Office Building Monitoring: Resolving the Ideal Temperature Debate at Ubidots HQ
Here at Ubidots we have this vexed topic that tends to turn friends into foes whenever it comes up: the discussion of whether the AC is too cold or not. We decided that the only way to square things up was to connect a couple of sensors that measure the temperature for us
Background...
As it may have happened to you before, here at Ubidots we have this vexed topic that tends to turn friends into foes whenever it comes up: the discussion of whether the AC is too cold or not. And as a data company, we decided that the only way to square things up was to do it our way, that is, connecting a couple of sensors that measure the temperature for us, take that data and make a graphical representation in the best possible way: a dashboard.
With that in mind, we went deeper into that same line of thought and asked ourselves, “are we working under ideal environmental conditions for our health?” It is well known that there are several respiratory tract infections triggered by inadequate humidity and temperature conditions.
Since we love to keep track of everything around here, we set ourselves the task to monitor the environmental conditions in which we work every day.
The Task...
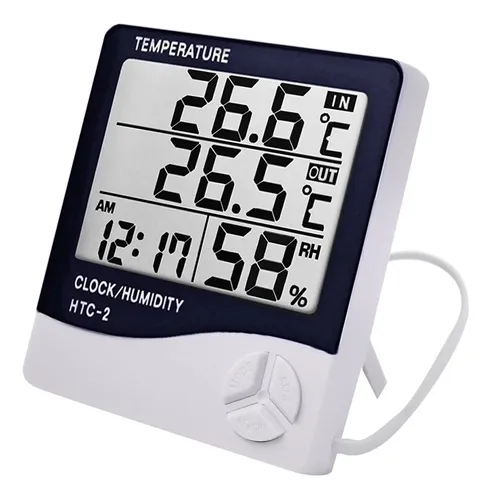
Keeping in mind that our main goal was to monitor temperature and humidity, the next step was to identify a device that gave us the most plug-and-play experience possible, that is, one that allows us to gather data from the mentioned variables and also to send that data using any means of wireless technology (we didn’t want wires hanging around).
This was the case because we wanted to focus our efforts on getting the data into Ubidots, processing it, and making a dashboard for us to use, rather than focusing on how we're obtaining and sending the data, connecting hardware, coding, and flashing devices. Now it was up to finding a suitable device that met our needs.
The Hardware...
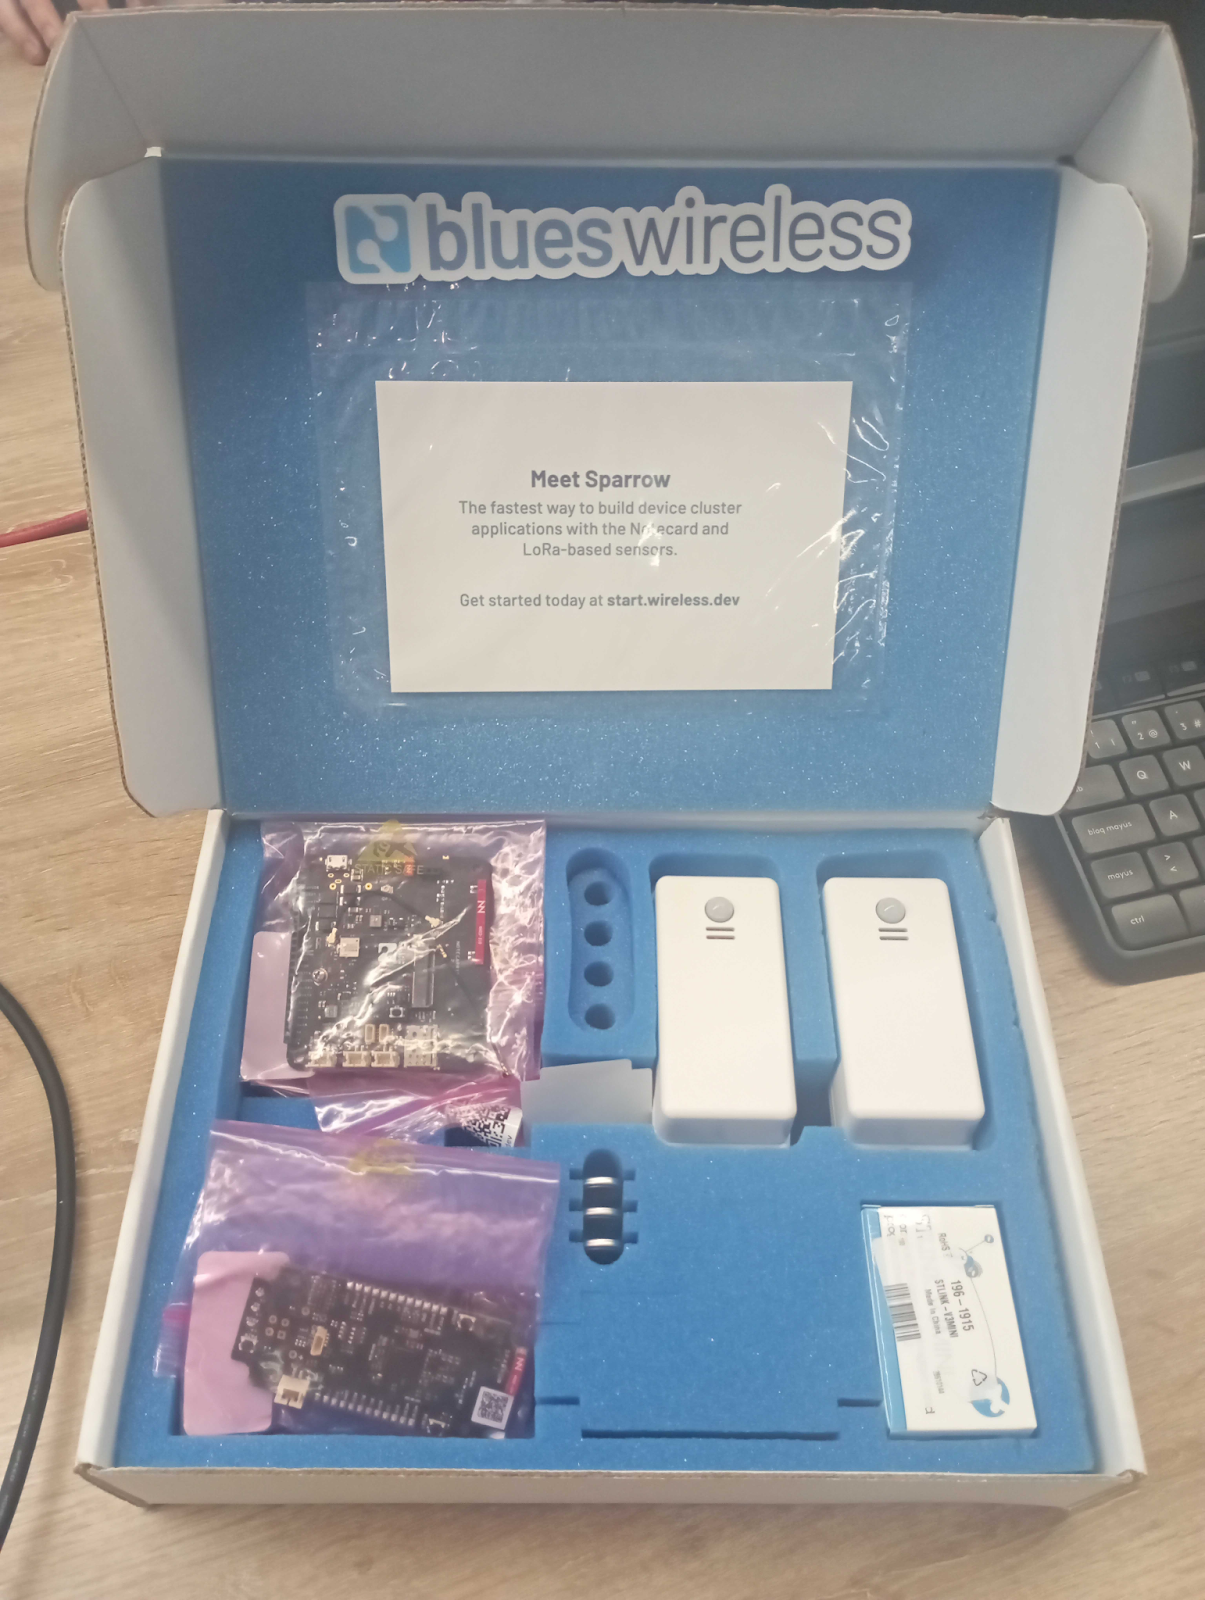
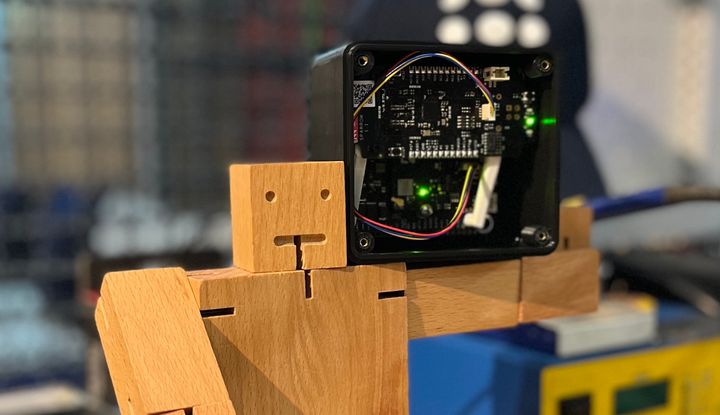
With the plug-and-play idea in mind, we took a look at the Sparrow Development Kit from our partners and friends Blues Wireless. Basically, this kit consists of two LoRa nodes that talk to a Wi-Fi gateway via LoRa, each node containing temperature, pressure, humidity, and PIR sensors.
The cool thing about this development kit is that it already comes with flashed firmware, so you only need to put on the batteries on the two nodes, power the gateway (Notecarrier) through a USB cable, and that’s it! You’ve equipped yourself with a system that measures pressure, humidity, temperature, and motion while sending the data to Blues Wireless Notehub, from which you can re-route the data to almost anywhere!
With that in mind, this development kit fulfilled our needs by far. Not to mention that Blues Wireless has great documentation, and being makers ourselves, having good technical guides is the most important thing (thanks, Blues team!).
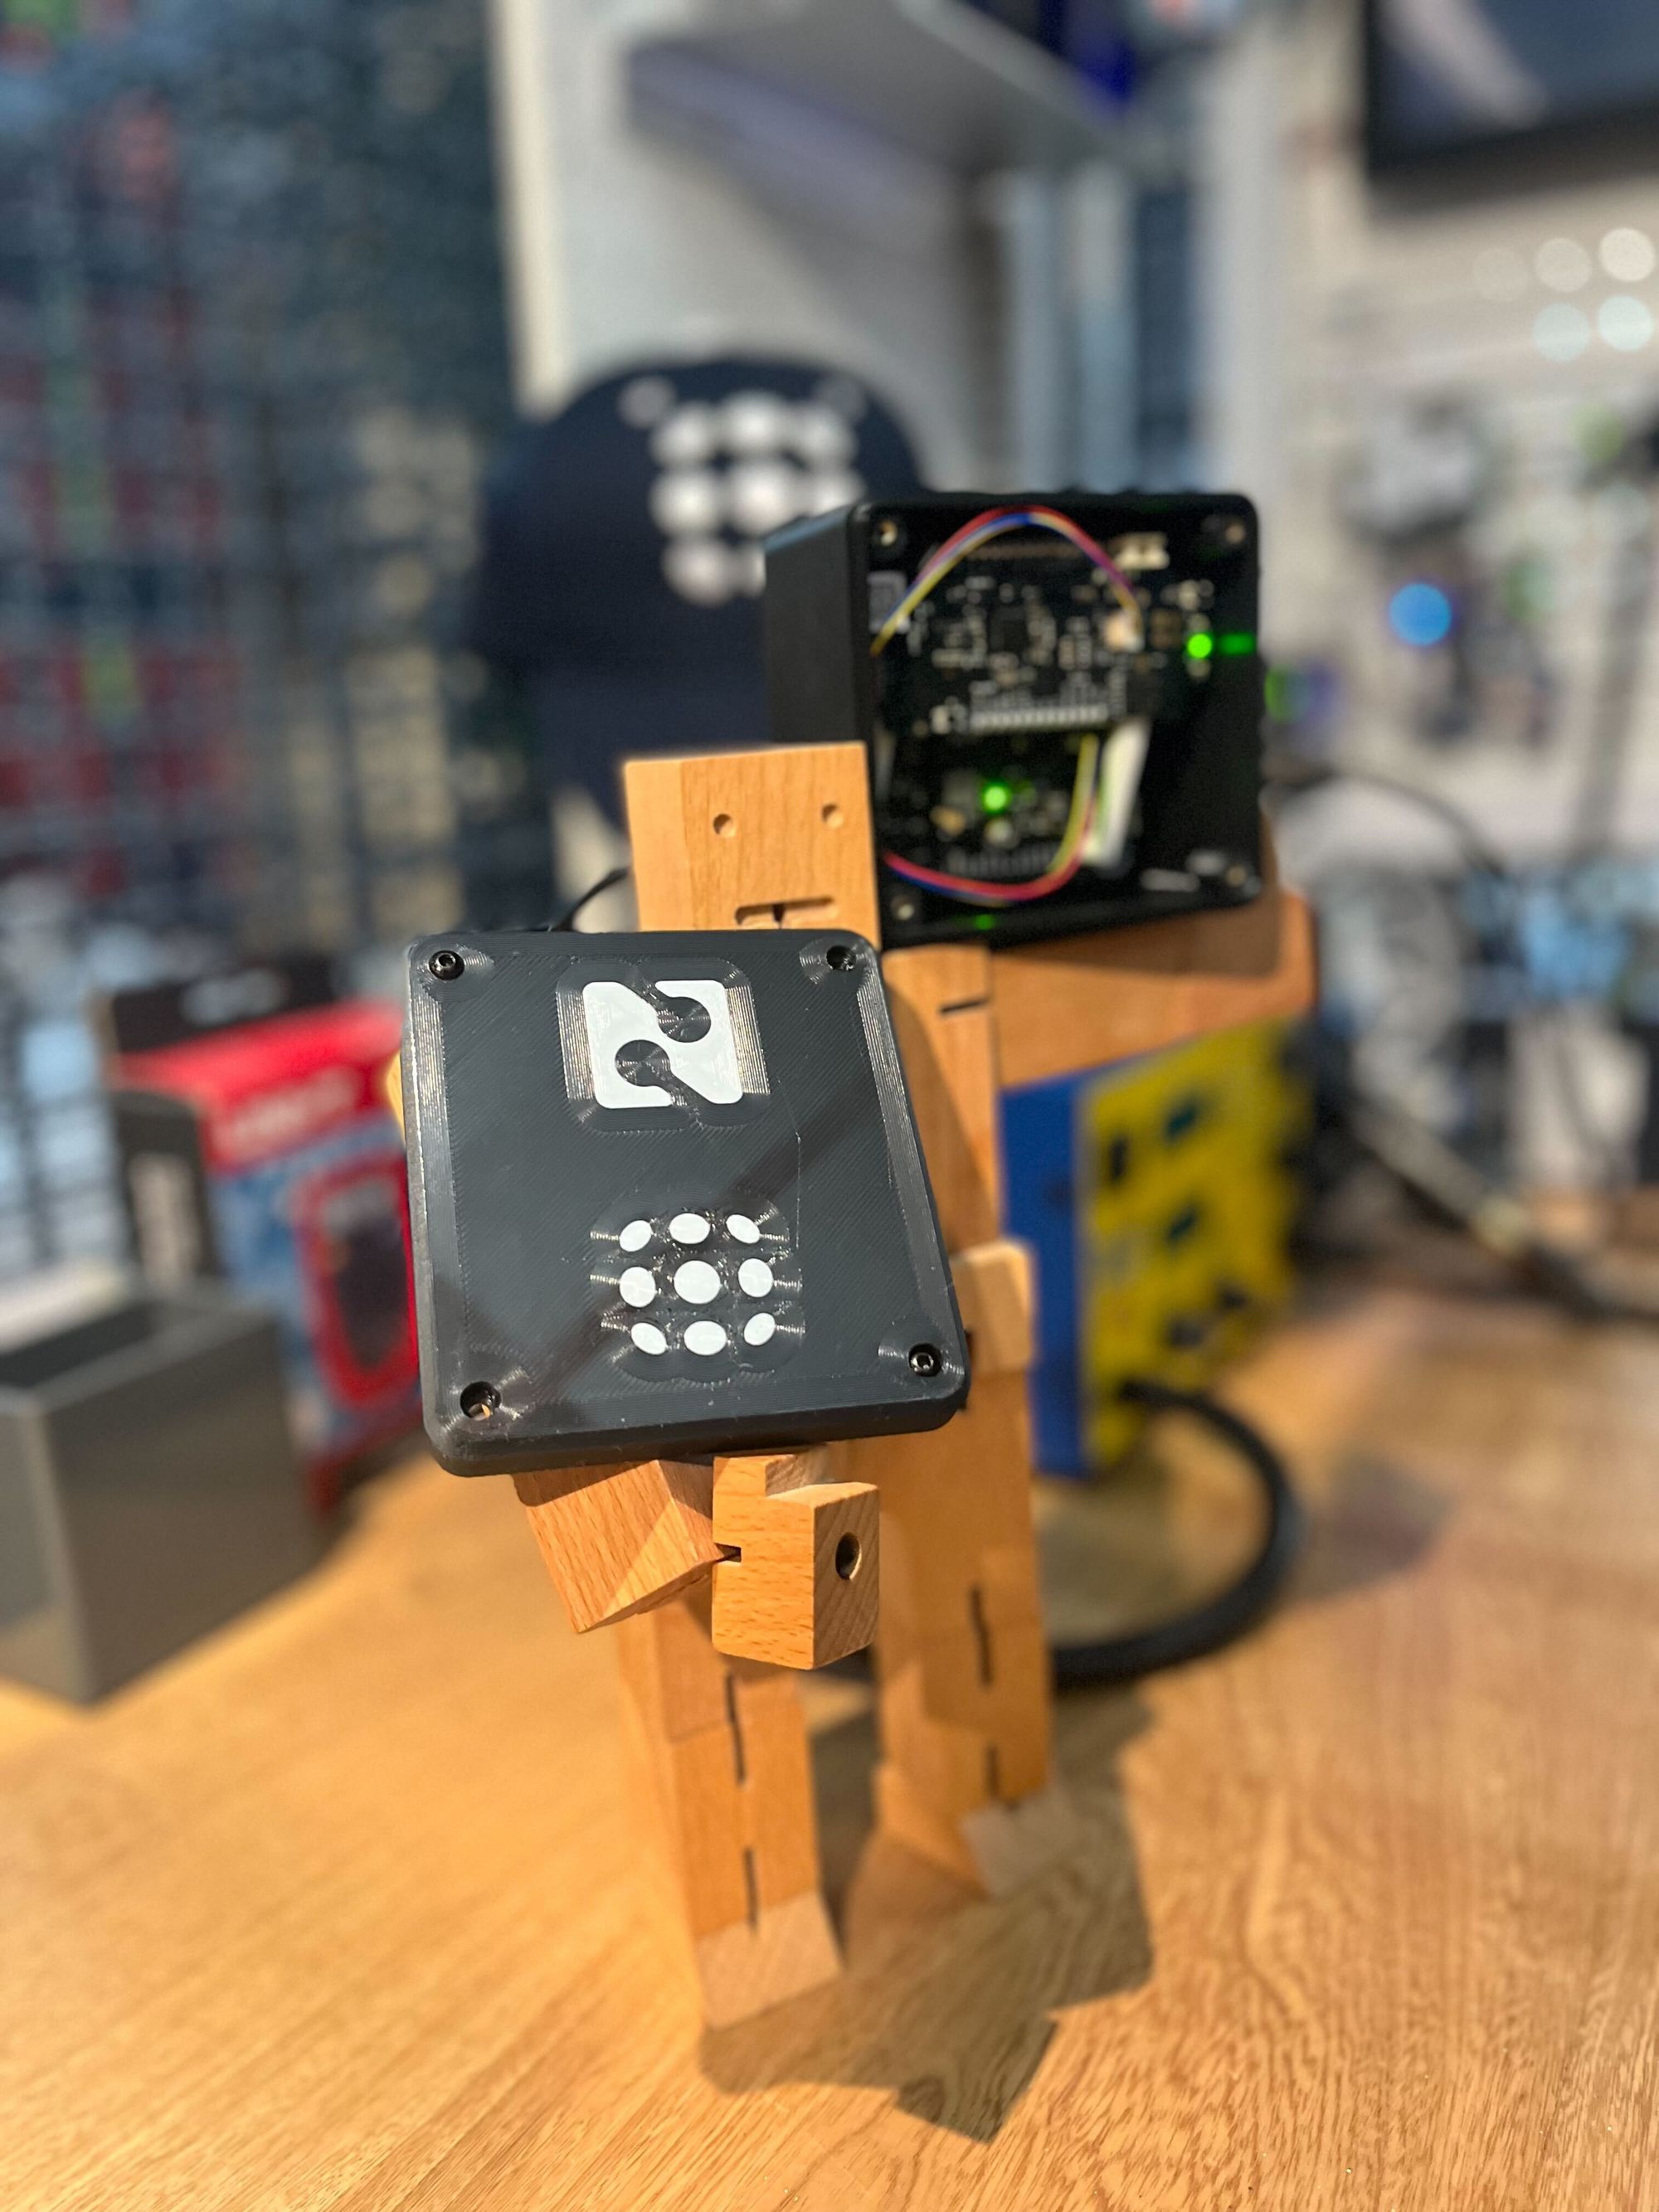
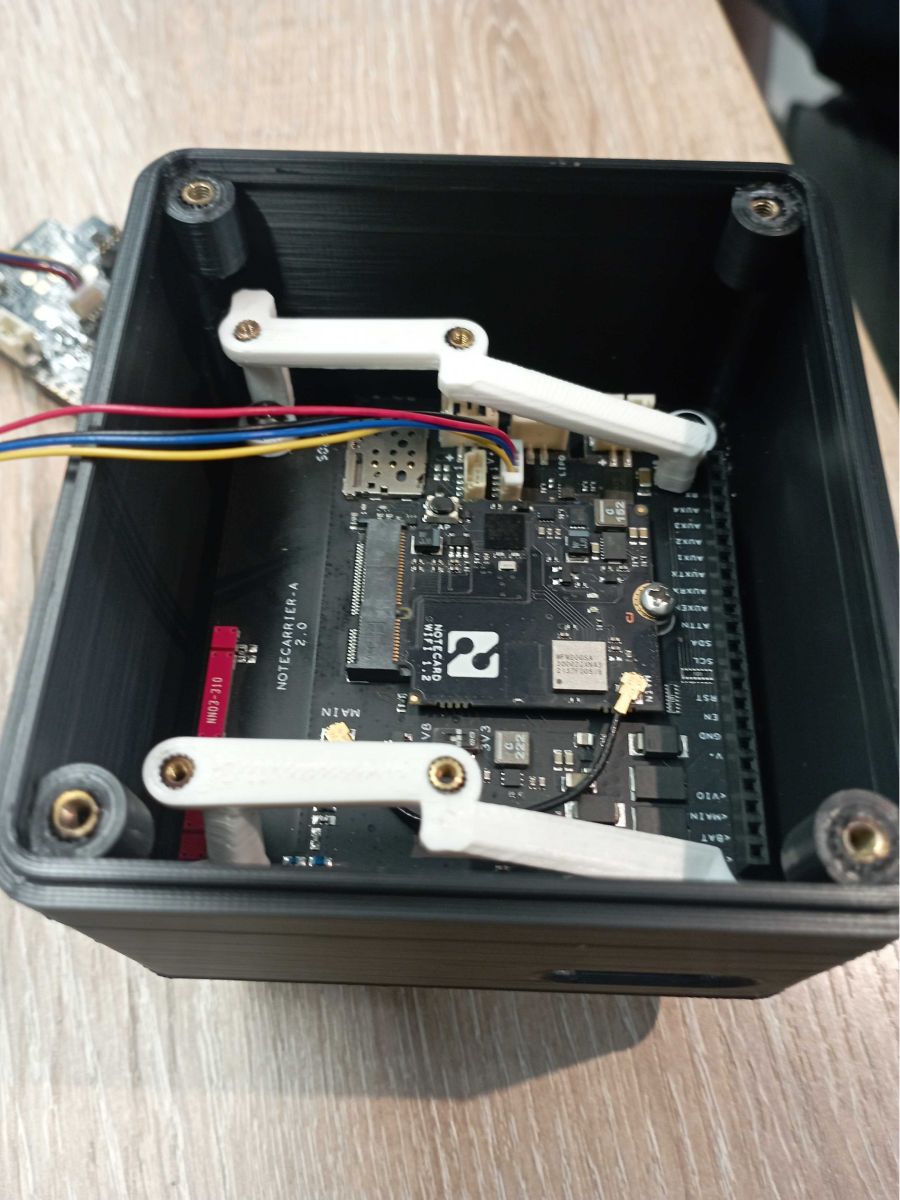
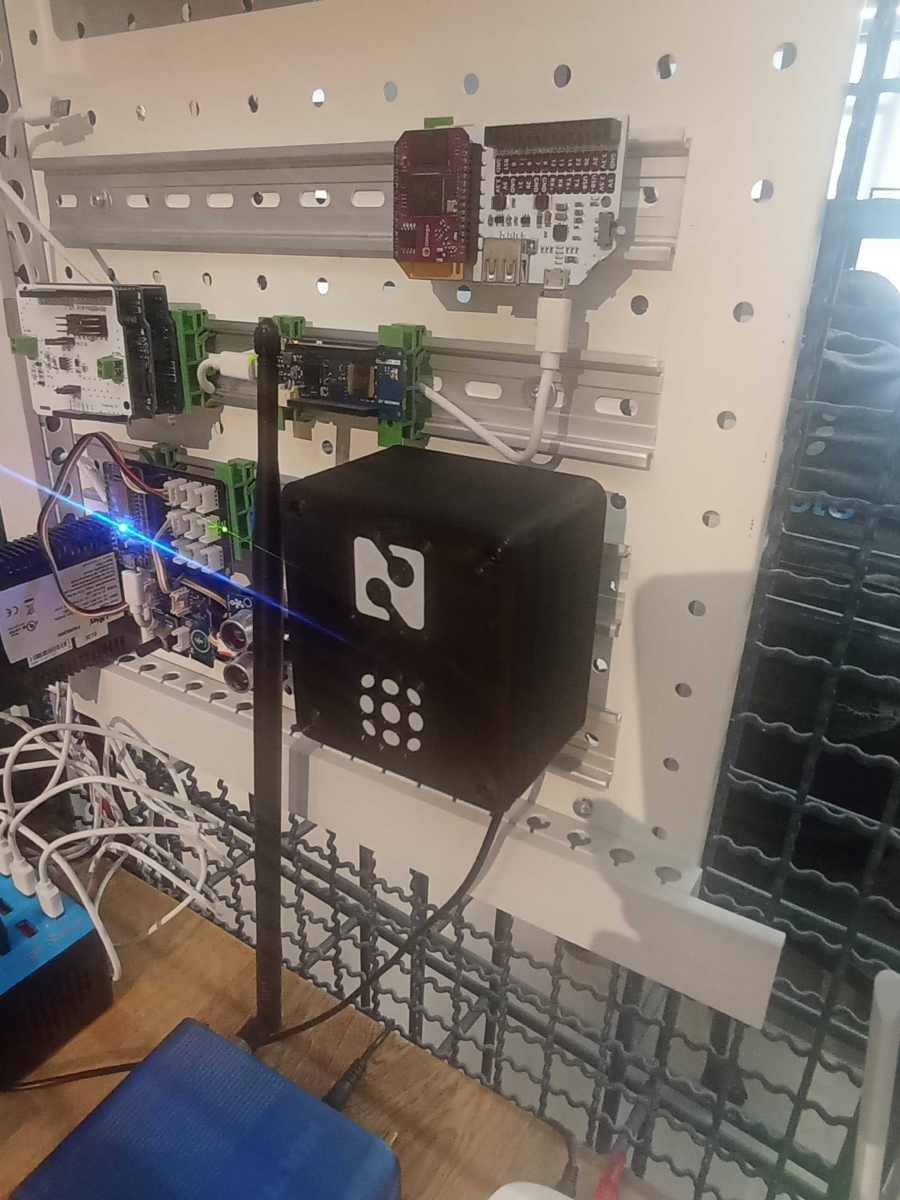
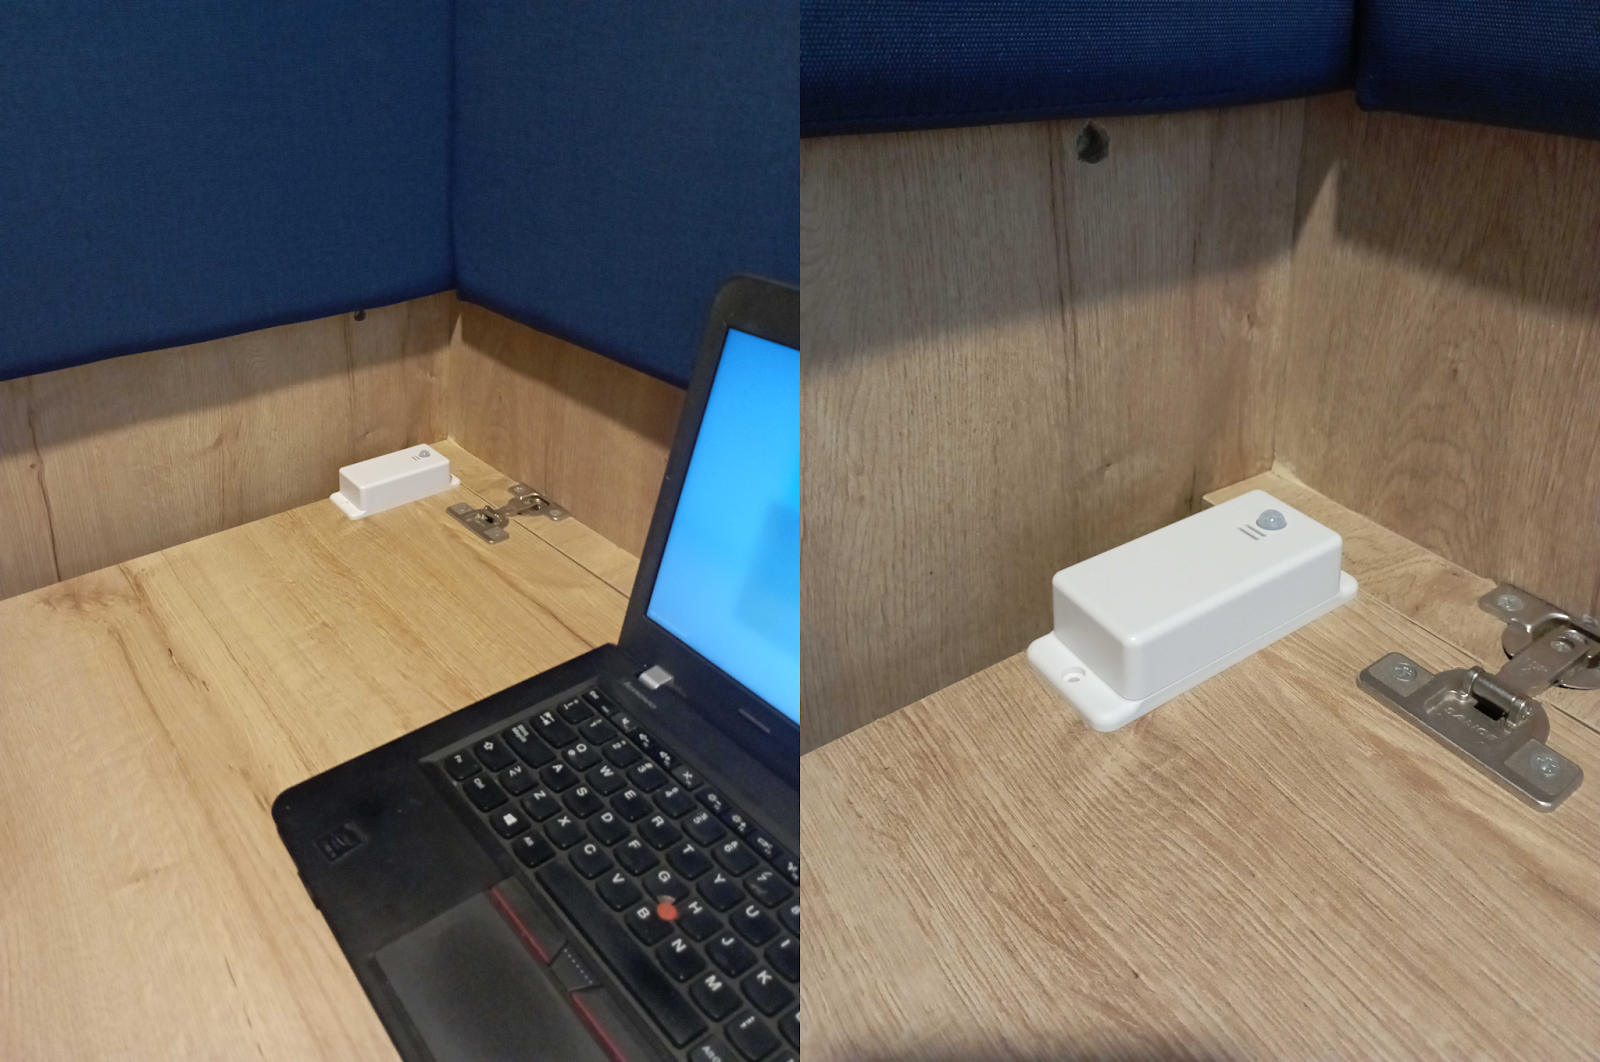
Now that we knew exactly which device to use, we put our hobbies to good use and printed a custom case so we could install it anywhere. Then we placed it in our headquarters’ maker space.
Placing the Sensors...
The next step was to have a clear idea of where we wanted to place the sensor nodes. For that, we established three-way criteria:
- Identify the place with the poorest natural airflow.
- Identify the place in the office where the majority of us are directly exposed to the air stream produced by the AC.
- Identify the place where most disputes over the temperature take place.
The Private Room...
This is "the room", widely used when someone needs to go into deep focus mode, come up with an idea to solve a particular task, or simply get comfy... You could say this is everyone’s favorite spot!
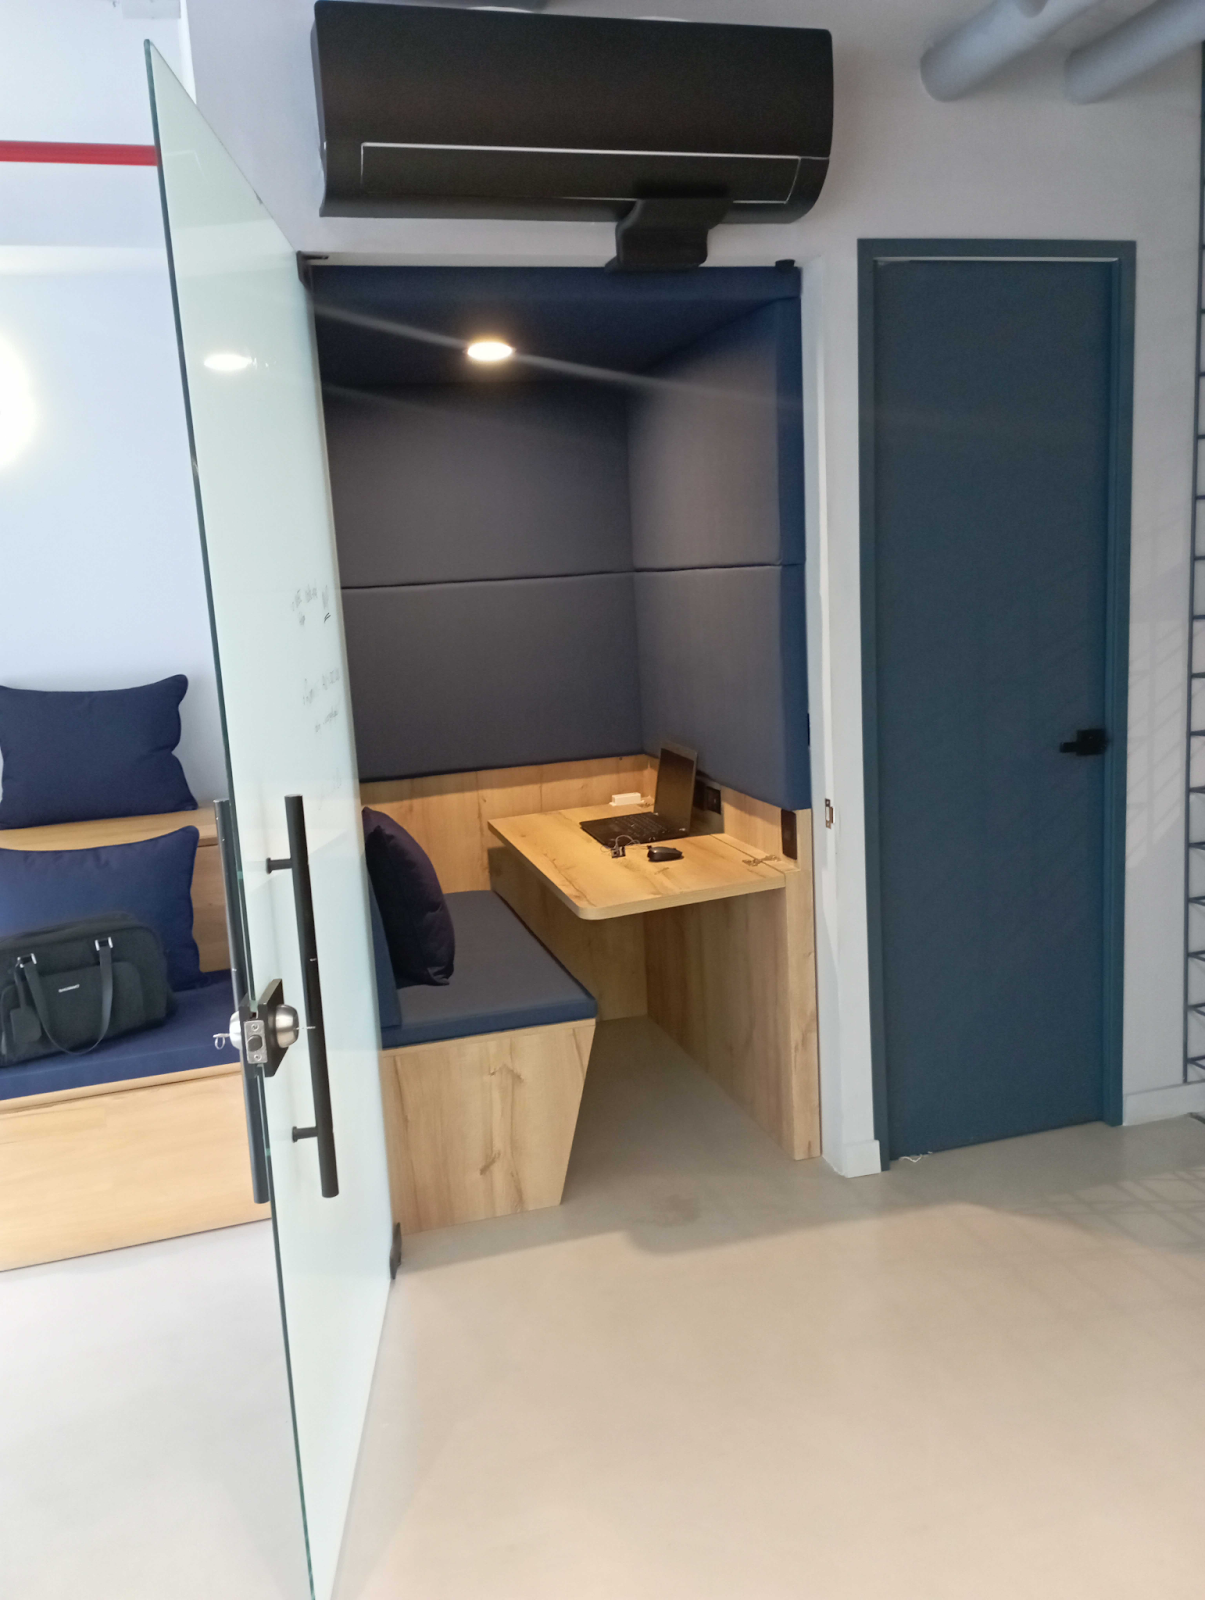
Given its dimensions (4 square meters, approximately), its lack of any windows, and taking into account that you want to have the door closed there, we considered it was the perfect candidate for our task at hand, since being such a small and closed space leaves no room for appropriate airflow to regulate temperature and humidity conditions... So a sensor node was installed there.
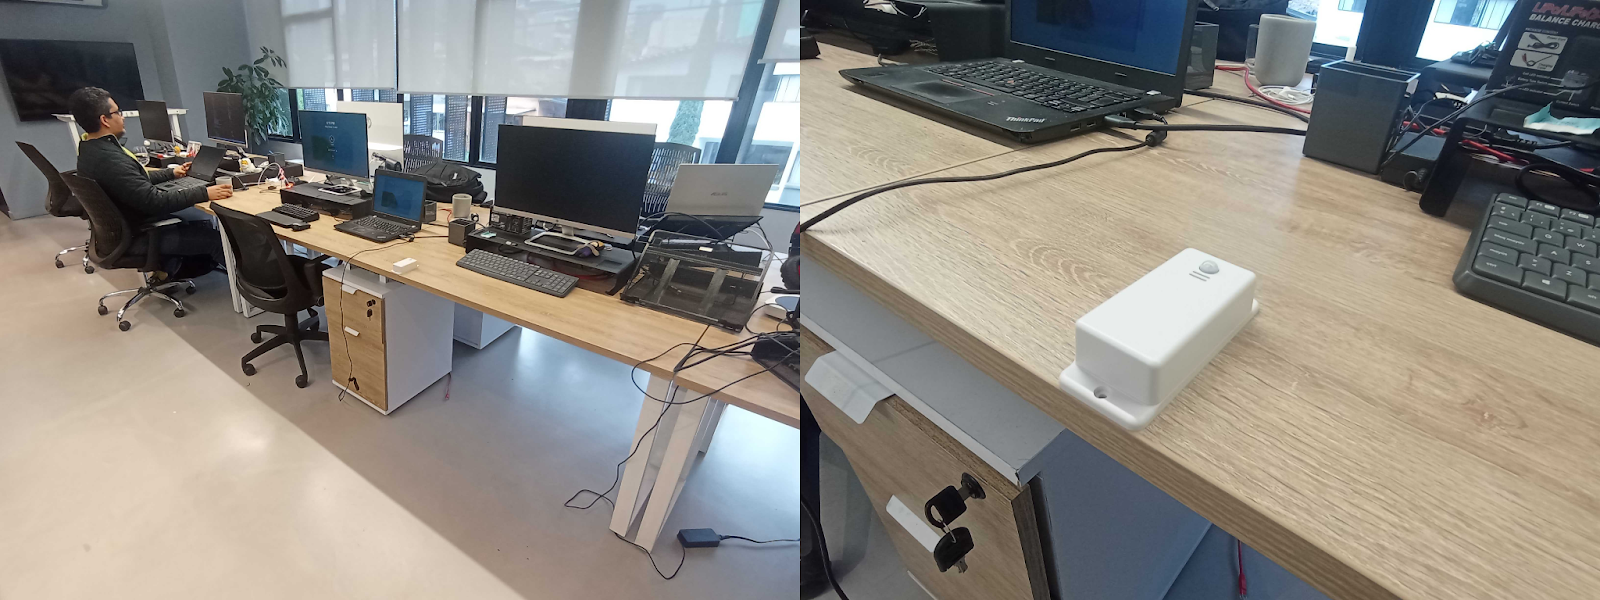
Office Workspace...
The other area of interest was the main room, in which our team spends most of their days building solutions that connect the world. Since this is the most used space in our headquarters, the airflow of all the AC units converge here and, thus, it’s where the battle over the office temperature takes place, with some arguing that it's colder than a Canadian winter, while the others insist that any degree above the current temperature will lead to heatstroke.
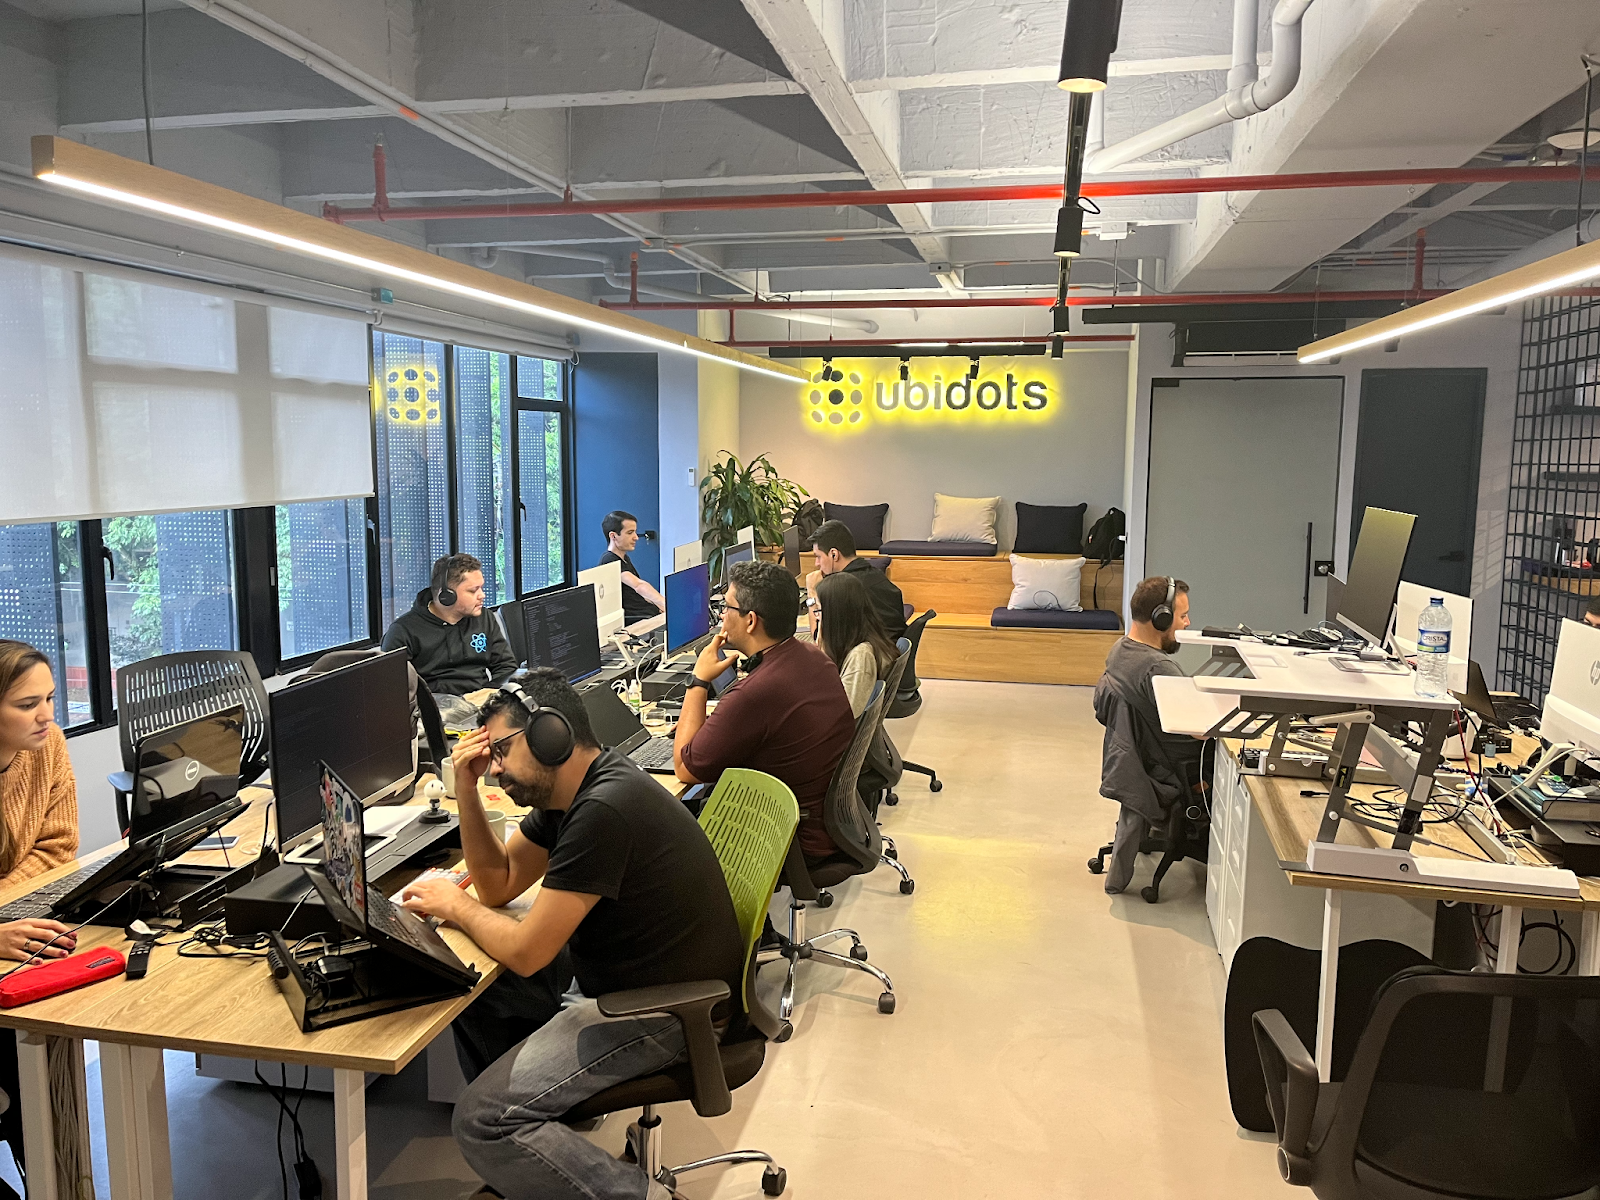
This being said, this place fully meets the criteria, especially the last one, for monitoring the environmental conditions, so a sensor node was installed there too.
Data Re-route
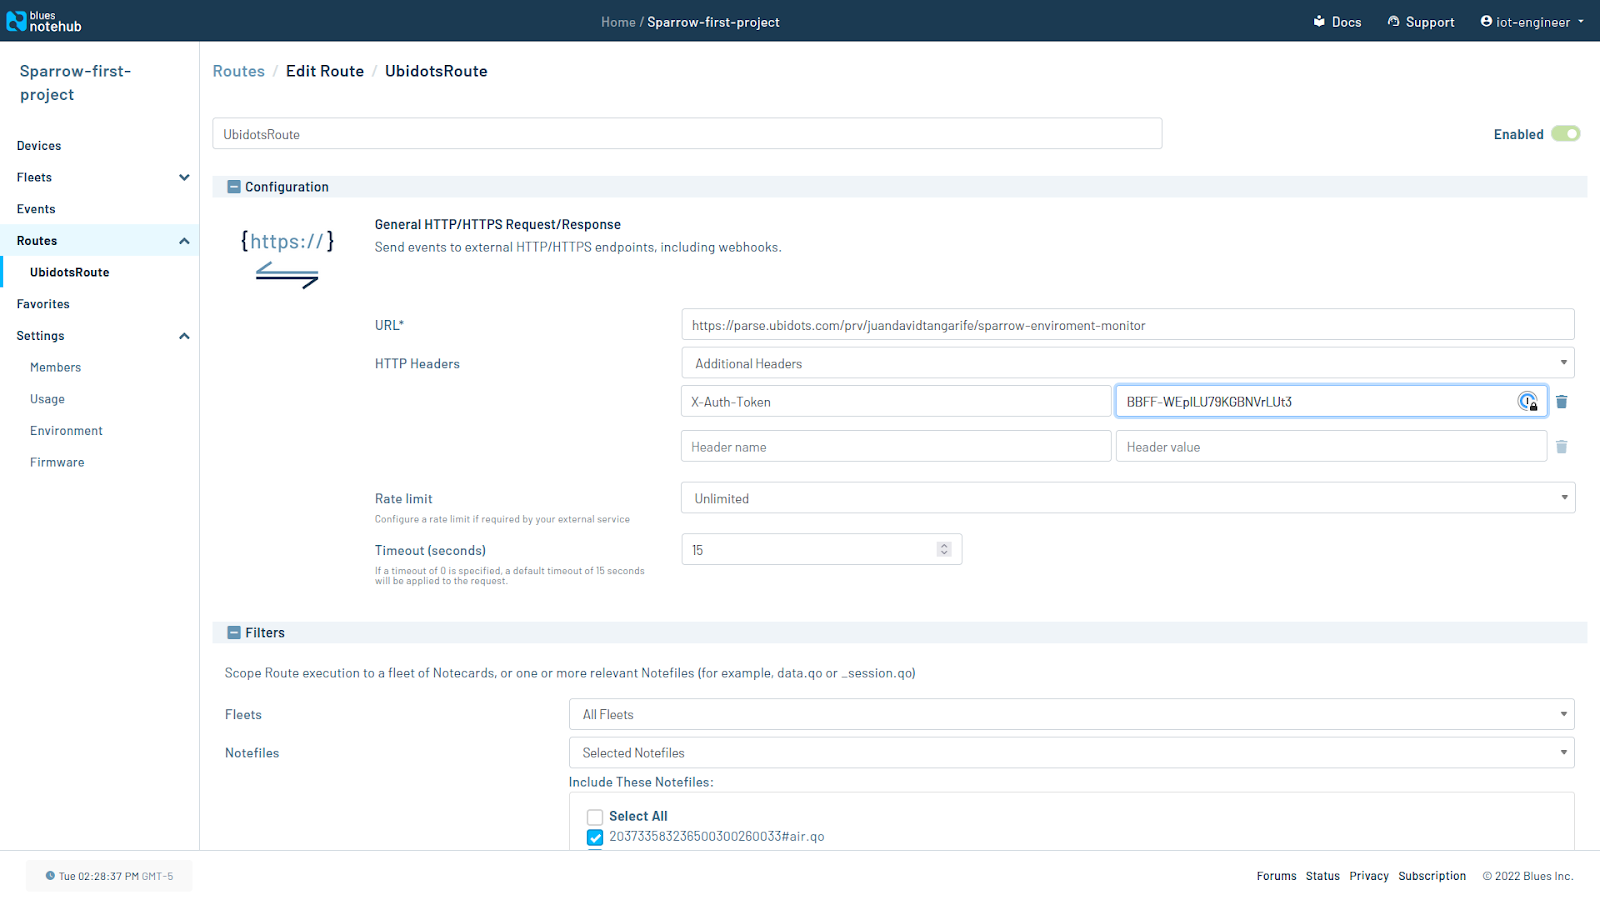
After finding appropriate spots for the sensor nodes, we jumped straight into establishing the data stream into Ubidots. This was achieved swiftly thanks to Blues Wireless Notehub’s “Routes”, which allows you to easily route the data from their cloud to any other platform of your choice, only by making a few clicks here and there.
Displaying the Data on Ubidots...
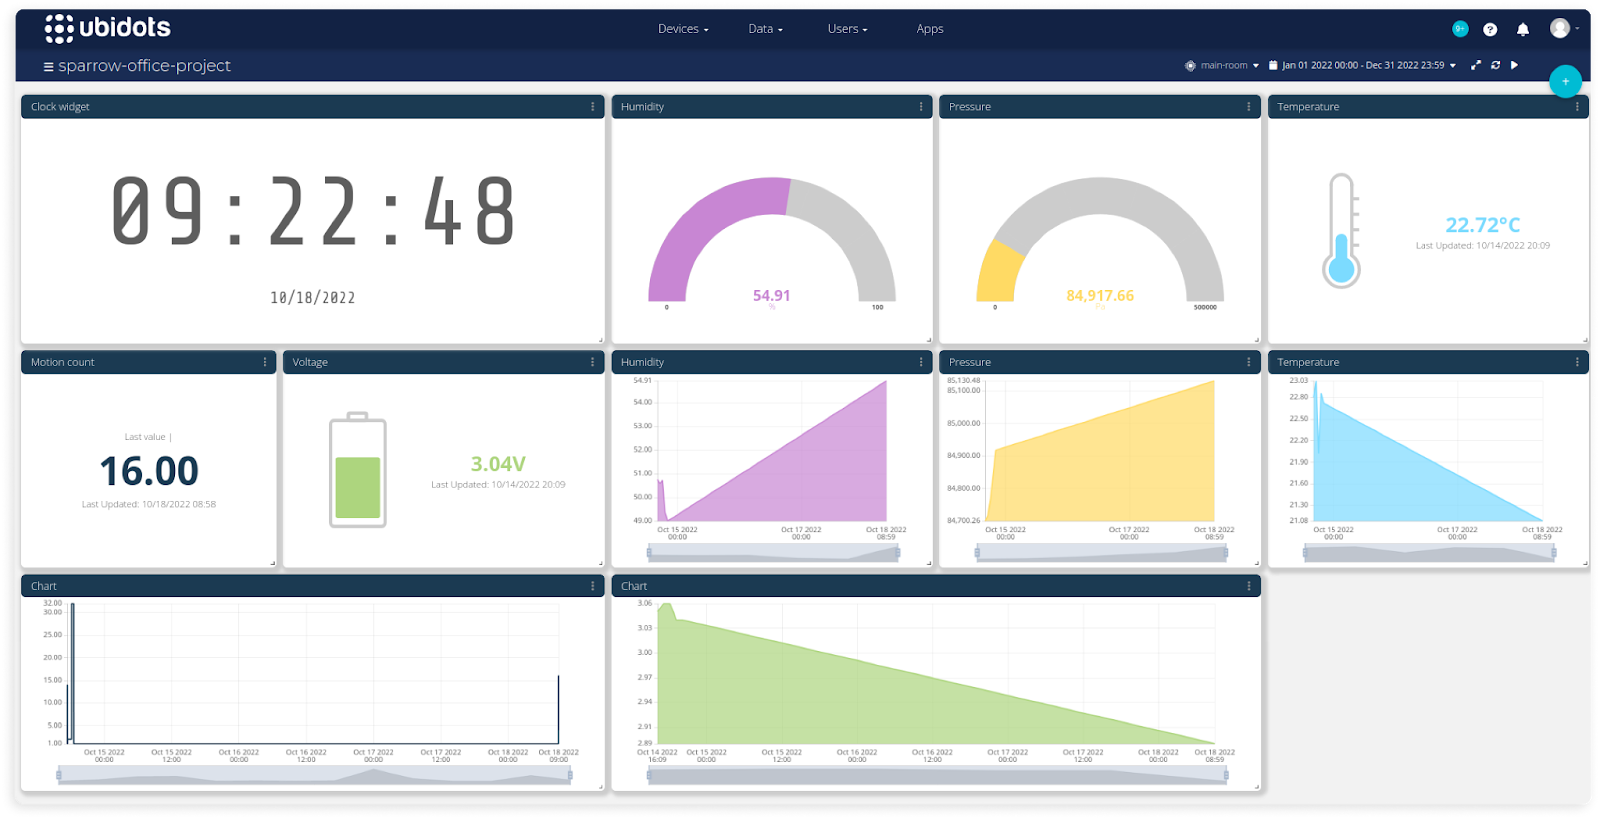
After doing what we are good at, which is connecting devices to Ubidots, the next thing on the schedule was to present the obtained data graphically in the simplest, yet most informative fashion, which is just exactly the description of a dashboard.
We decided to graph all four variables that the device measures. Apart from temperature and humidity, we thought it would be cool to investigate the time at which people arrive at the office, as well as when they leave, so we made use of the PIR motion sensor. Now, every time someone enters the office they trigger the sensor, thus, leaving a trace of their arrival time. Same thing when they leave.
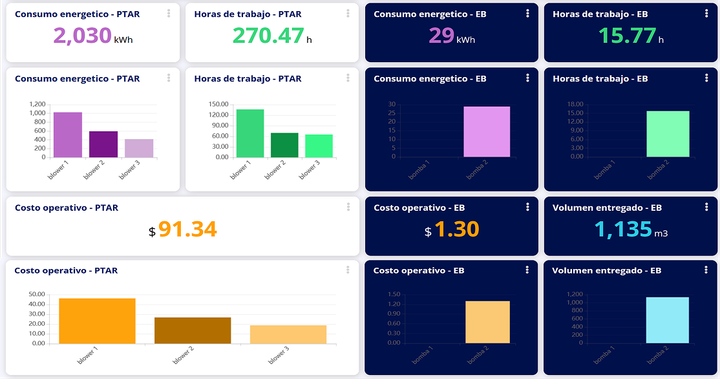
Here is a snapshot of the dashboard specially made for this project.
Aftermath...
As a result, after checking the obtained data, we realized that the average relative humidity in the office is around 50%, while the temperature lies around 24 °C.
First, we wanted to compare the obtained data with the values known to be optimal for health:
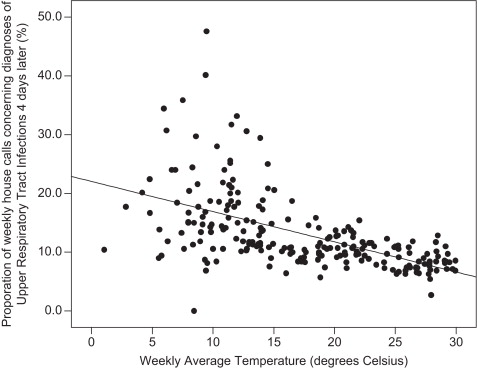
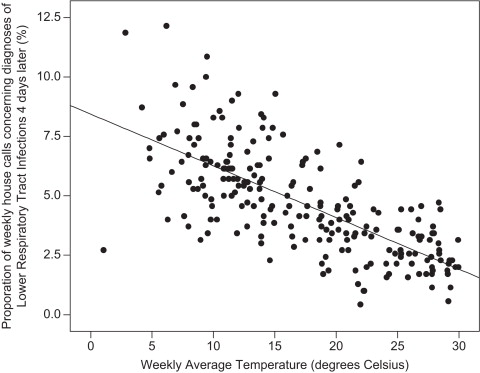
As can be seen in the above pictures, the relative risk of contracting a respiratory tract infection increases with low temperatures. Based on this, we decided that the safe temperature interval in our office is over 20 °C.
Next, we wanted to compare the data with those considered ideal values when thinking about comfort:
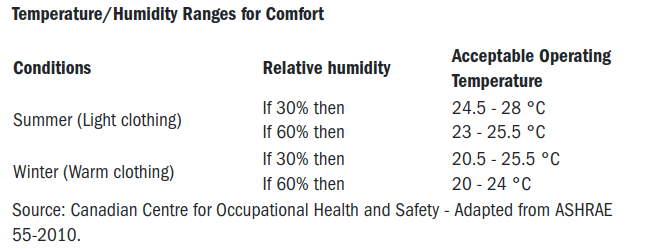
Taking into account both the health and comfort approaches, most of us decided that the best temperature for the headquarters was around 20 °C, considering that humidity varies around 50%.
Now we have criteria for not just setting up the AC values according to what someone wants, but actually based on technical facts... Finally, the battles over the AC’s control will be damped —at least a bit—.
References and resources:
- [1], [2] Matthew E. Falagas, George Theocharis, Alex Spanos, Lambrini A. Vlara, Evangelos A. Issaris, George Panos, George Peppas,
Effect of meteorological variables on the incidence of respiratory tract infections, Respiratory Medicine, Volume 102, Issue 5, 2008, https://doi.org/10.1016/j.rmed.2007.12.010