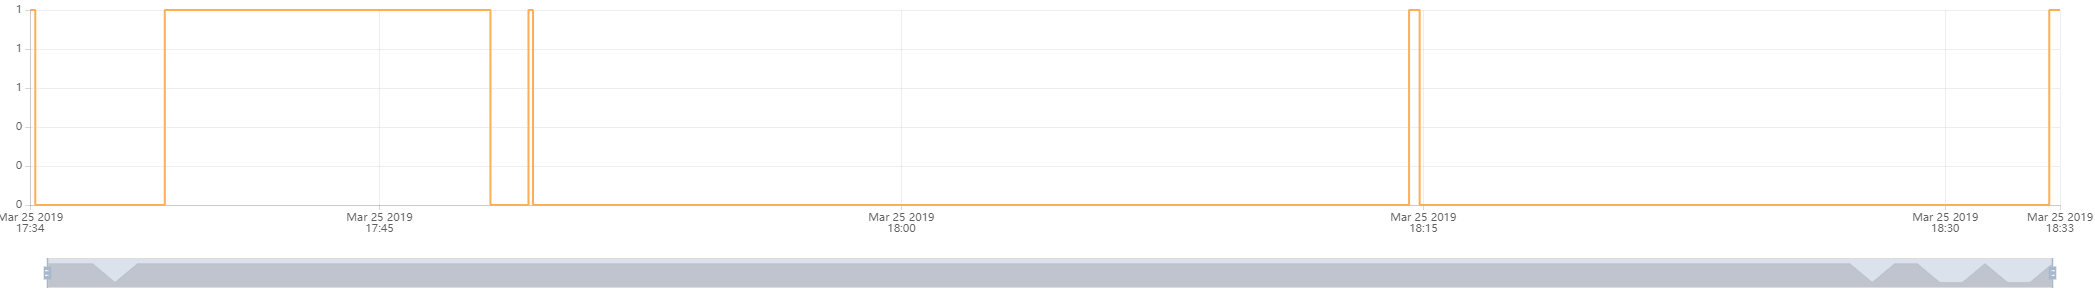
I’ve found a bug in the line chart widget when using the “Visualize as a step line chart” option. I’m tracking a boolean value (0 and 1) on the step line chart, and the steps are not displaying the value of the 0 and 1 value properly.
At times when there is a 1 value last sent, the step line is at 0, and the opposite is also true sometimes. I know Ubidots is receiving the value properly - it’s just a matter of displaying this value correctly.
I think it might be helpful for this feature to have an option of selecting where the step line should snap to (i.e. before the last data point, after the last data point, etc).
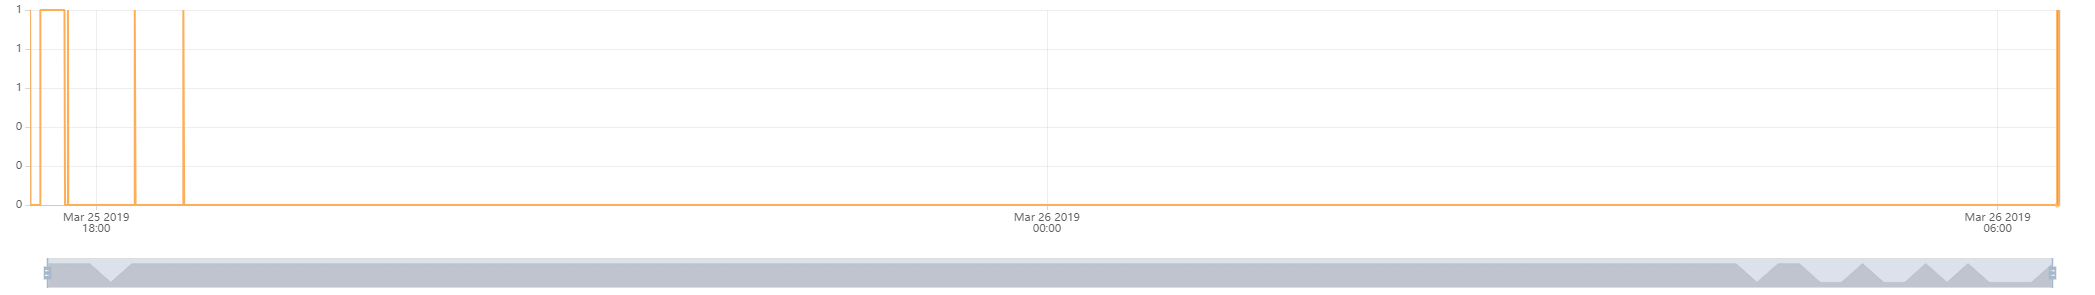
On March 25, at 18:33, there was a “1” value sent to this graph widget. There wasn’t a “0” value sent until March 26, at 06:22. So, why isn’t the square wave in the graph high during this period? I think there may be a logic problem in how the step feature of this widget displays 0’s and 1’s.
After some debugging, I was able to reproduce the results described by you in regards to the option “Visualize as a step line chart”. Indeed, dots are being put together erroneously, when values is 1, it connects dots as if was 0 and same happens the other way around.
I’ll forward this report to our development team and let them address it, fix it accordingly.