IoT Dashboards – Attributes, Advantages, & Examples
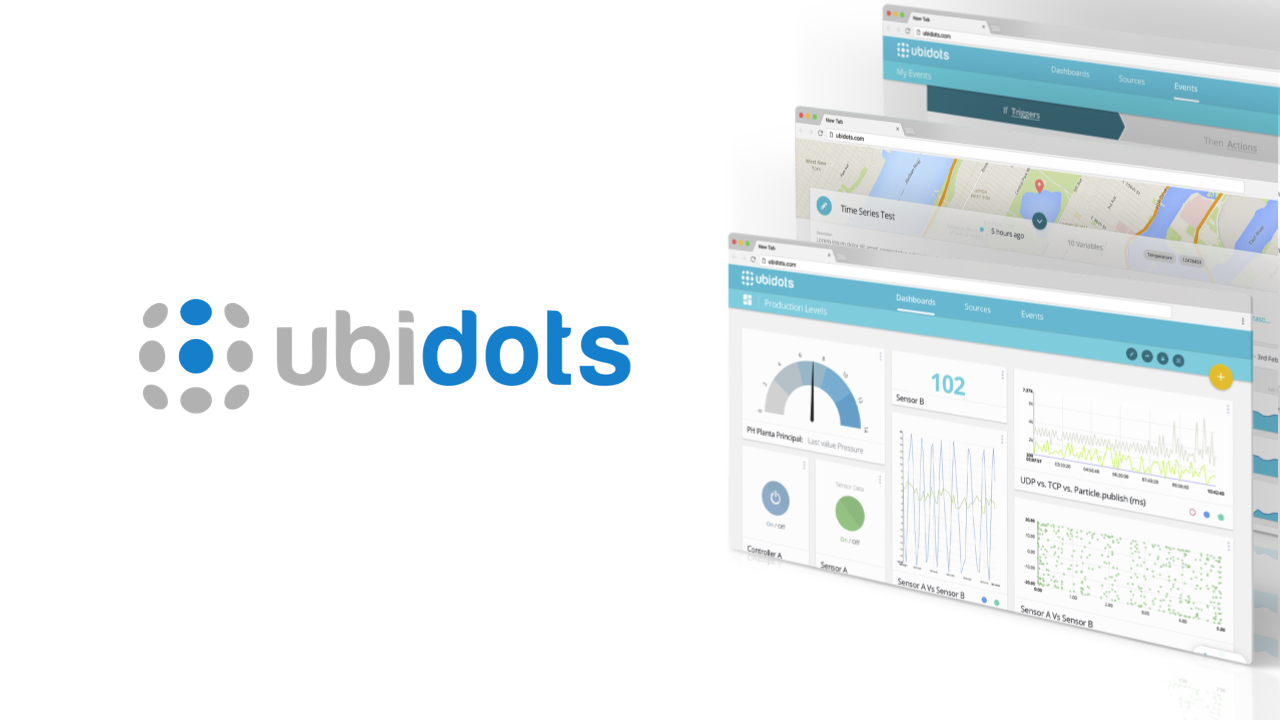
For the Internet of Things, or any control system, the dashboard or IoT dashboard is the key HMI (Human-Machine Interface) component that organizes and presents digital information from our physical world into a simply understood display on a computer or mobile device. With the help of IoT Dashboards, users and operators can (remotely) monitor and control specific assets and processes, and depending on safety requirements, access and control an environment from anywhere in the world.
Attributes and Advantages of IoT Dashboards
They monitor and control physical assets. The IoT can be simply understood as the digitalization of our physical world; while many common data sources are purely digital like financial stock prices, the Internet of Things utilizes input/output devices and sensors from our physical world to display insights from an environment or its systems. IoT dashboards populated with graphs, charts, control switches, maps, tables, and countless other widgets are the digitals tools we use to visualize and display data coming from the physical world to our computers.
They’re used by both businesses and individuals. While the use of dashboard to view company stats is not new for businesses, making the data readily available to employees, management, and customers at the same time is. Businesses are now adopting the IoT to incorporate cloud data-analytics to improve operating efficiency and worker safety, then relay this data to customers or vendors for increased product transparency. Similarly, individuals are adopting the IoT to improve the efficiency of one’s own mind and body thanks to fitness trackers and home alarm systems. In both scenarios, end-users have access to specific IoT dashboards as HMIs that present data relating to the status of a system or events (door open, smoke detected, 4 miles traversed); all the while not requiring programming skills to operate either system.
They’re cloud-based and global. The Internet of Things (IoT) adoption is – in part – thanks to the expansion of cloud computing and its proficient data collection, processing, and analysis capabilities. With the global accessibility of cloud data-storage platforms like AWS, Azure, Blumix, and Google Cloud no longer do businesses or private users need servers rooms to store data nor the on-hand IT engineer to run it. With the global architecture of most cloud or IoT service providers, IoT dashboards can be accessed simply with a URL and any standard browser or mobile application – anywhere in the world.
Want to learn more about Industrial IoT? Download “A Practical Guide to Smart Manufacturing.”
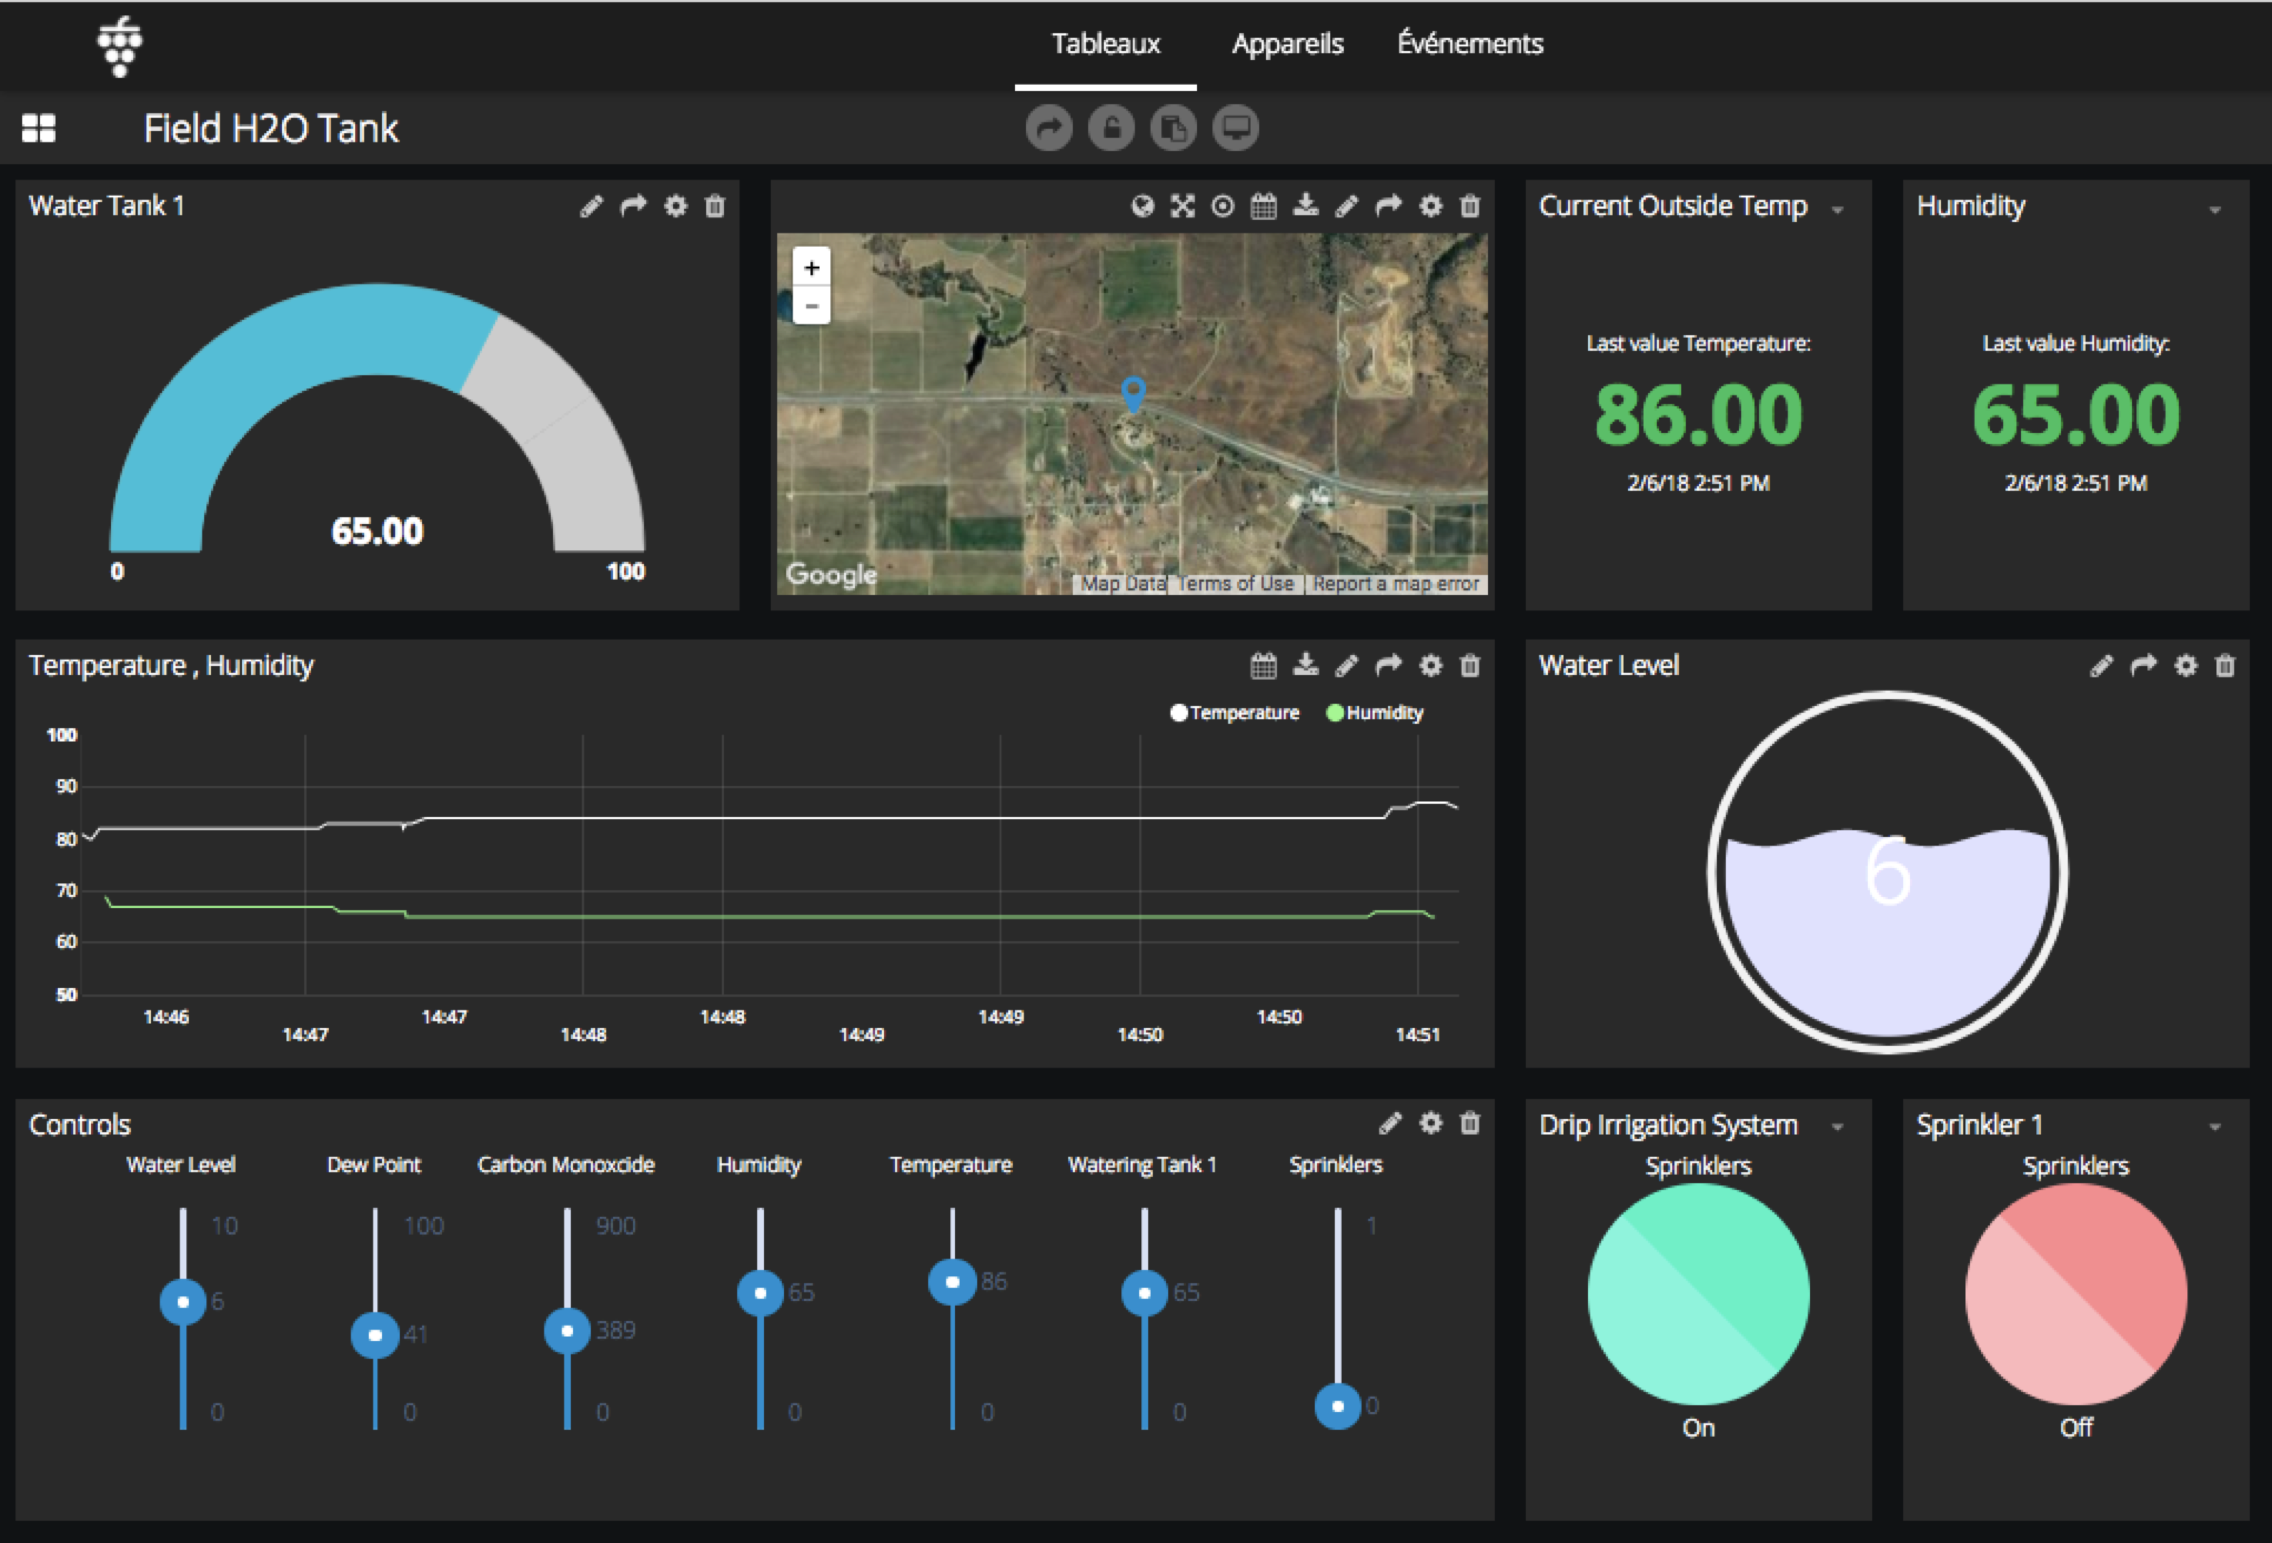
Tank level monitoring IoT dashboard
Examples of IoT Dashboards
- Real-time GPS asset tracking and condition monitoring
GPS tracking has been a tried-and-true method for Logistics companies for more than 20 years. So why would one upgrade -and assume extra costs- to connect vehicles to the Internet to track position and cargo conditions?
With the technological advancements in sensors and falling prices of single board computers, connecting vehicles to the Internet now goes far beyond the routine asset tracking application. An asset’s location is important but when paired with virtual data like weather, traffic conditions, or fuel prices, users can optimize routes and plans based on real-time conditions – improving quality and reliability while saving time and resources.
For example, the IoT dashboard below tracks the International Space Station in real time (build it yourself with this tutorial).
It’s been estimated that the true cost of a machine breakdown is between four and fifteen times the preventive maintenance costs. These downtimes are costly in both repair costs and opportunity lost.
With the implementation of embedded smart sensors on machine parts and production lines, system operators continue to rely on data-driven displays to immediately know a machine’s health (temp, pressure, lubricants, or vibration frequency) and see exactly how a machine or system is performing. And, with the assistance of cloud analytics and anomaly detection, better know if a machine or possibly its operator is in danger. For example, with the IoT, if a tank’s pressure exceeds a max threshold the smart valve might open automatically and release the pressure and reduce the threat of tank explosion.
To give the operator a clear sign of danger or action needed, digital panic buttons and alert systems have become commonplace in IoT dashboards to keep employees informed and machines safely operating.
Applications can be embedded to websites just like you see below with this. Scroll down to see more active widgets.
- Energy and Environment monitoring
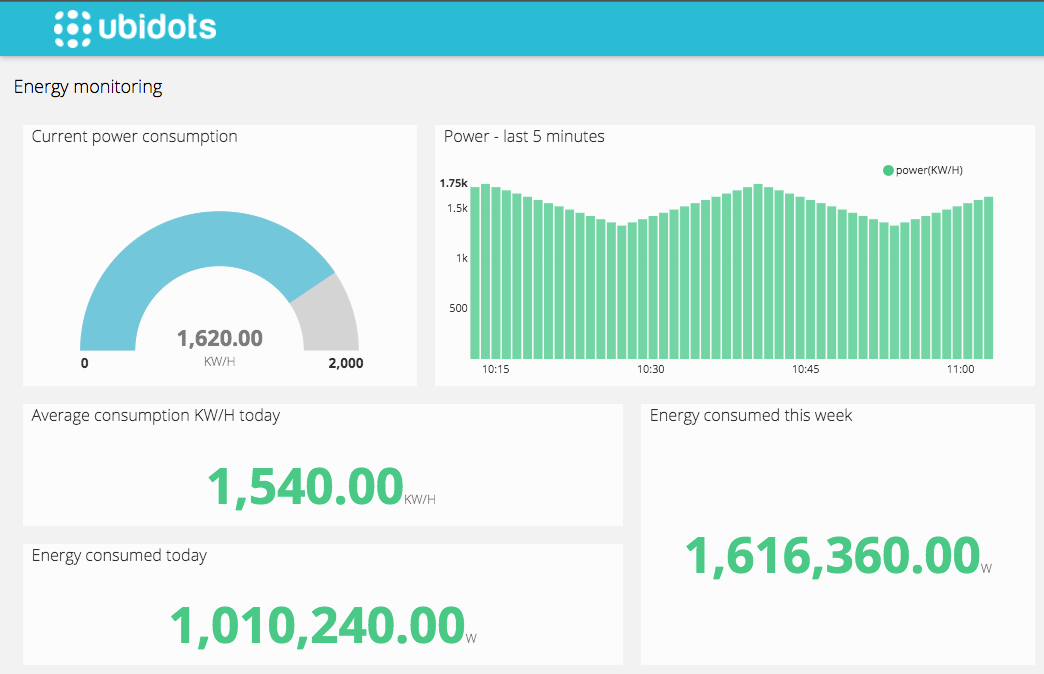
Energy and Environment monitoring go hand-in-hand and being able to visualize both in a single IoT Dashboard give users immediate insights into a system or ecosystem. Higher stage digital mature businesses are now even automating energy consumption with smart HVAC systems or machine control subsystems which stipulate that when a temperature rises above a specified threshold or when energy prices are below a specific price, activate the system.
By combining smart energy monitoring solutions with environment monitoring —as described above— operators can uncover leaks, mitigate downtimes, and reduce environmental impact.
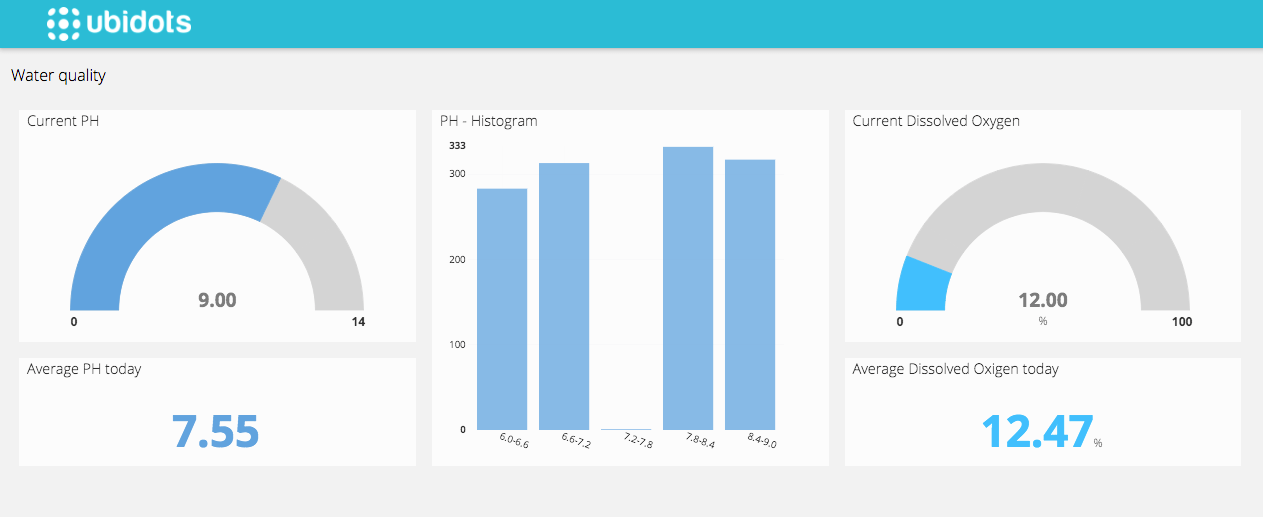
About Ubidots IoT dashboards
The Internet of Things and Control Systems are automating our homes, remotely monitoring assets, and economizing energy consumption on a global scale. Using Ubidots’ cloud software users can self-develop IoT dashboards to deliver insights from sensor data and improve operational efficiency, economize resources, and cut costs.
Learn more about Ubidots IoT dashboards and the problem-solving capabilities of IoT and cloud solutions with Ubidots’ point-and-click development tools.
Stimulate the developer in you with Ubidots IoT dashboards.

