I’m using Ubidots to monitor my Homebrew using an iSpindel.
I monitor the Specific gravity, Tilt angle, temperature, battery level and more, but the graphical representation plot of the values is correct but the X axis data zoom representation is the reverse of the actual plotted graph.
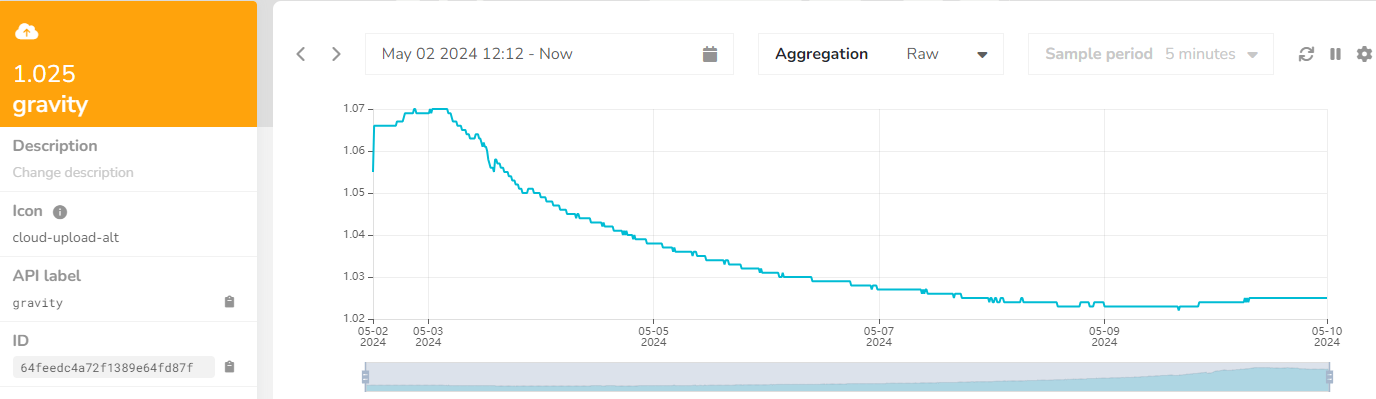
This is an example of the SG graph:
The actual graph is falling yet the data zoom is rising ! Why is this?
I can live with this but why has this difference recently occurred and why?
I would be grateful for any answers and or solutions to my problem.
Thank you
Hello @JeffPinter2,
I trust you are well.
Sorry we took so long to reply. I understand you are referring to the graph below the X-axis. As you mention, the graph is reversed to the actual plotted graph. This shouldn’t be happening, and the team is now aware of this issue.
This issue isn’t present in the old variable view in our platform, so I’m going to switch you back to the old view while we fix this. Your username in Ubidots is “JeffPinter2”?
As soon as I have more updates on this, I’ll let you know.
–Camilo
Thank you Camilo for your response and for switching me back to “the old variable view” but nobody announced there was a new view??!!
Yes my username is “JeffPinter2” and I can see all variables are now graphically displaying correctly.
Thank you again for your response and actions which has solved my problem 
 Jeff.
Jeff.
You’re welcome Jeff. The announcement was made in our last newsletter, and in our announcements page. I leave the link here so you can take a look.
https://docs.ubidots.com/changelog
It is our pleasure to help, and apologies for the inconvenience caused with this error.
–Camilo