Hello @rowe, getting 402s could be caused because of hitting the limits of Dots in or Dots out. It seems strange that you were still having problems loading your data even after the Quota message was gone.
I’ll add this to the ticket that is reporting these cases so that it hopefully gives more resources to the Developer in charge of it.
I accidentally pulled a huge volume of data out into an XY graph on my dashboard by setting the timespan to “all time”. Stupid, but due to using a mobile device with sausage fingers.
I waited patiently for the quota to reset, which it did not then for the number of days’worth of dots I had extracted to pass … And nothing. I disabled any calculated variables and finally my events- but still no change at midnight.
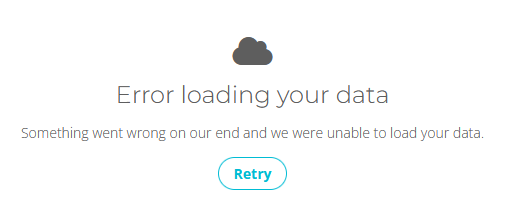
I still got the error message of having extracted the same huge number of dots every time and I couldn’t see the data in the variable page except for the latest value in the device summary page.
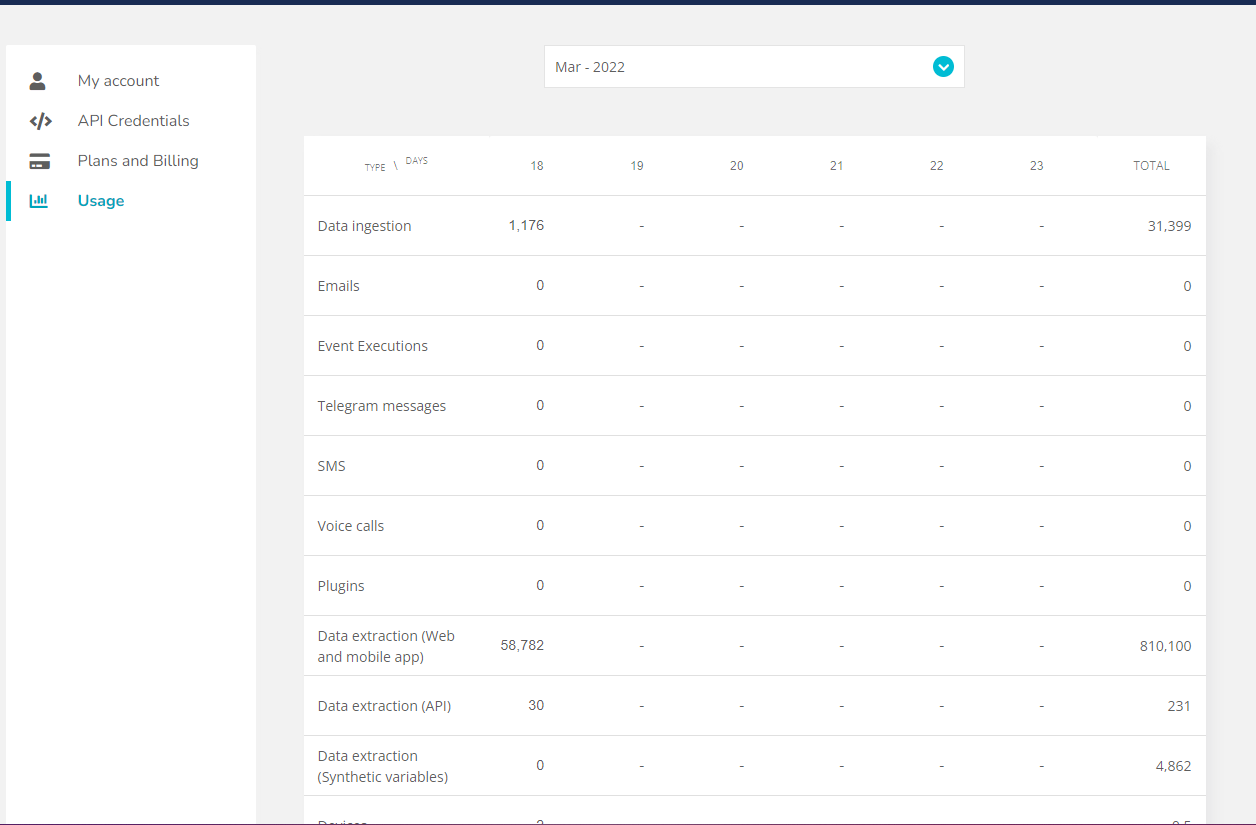
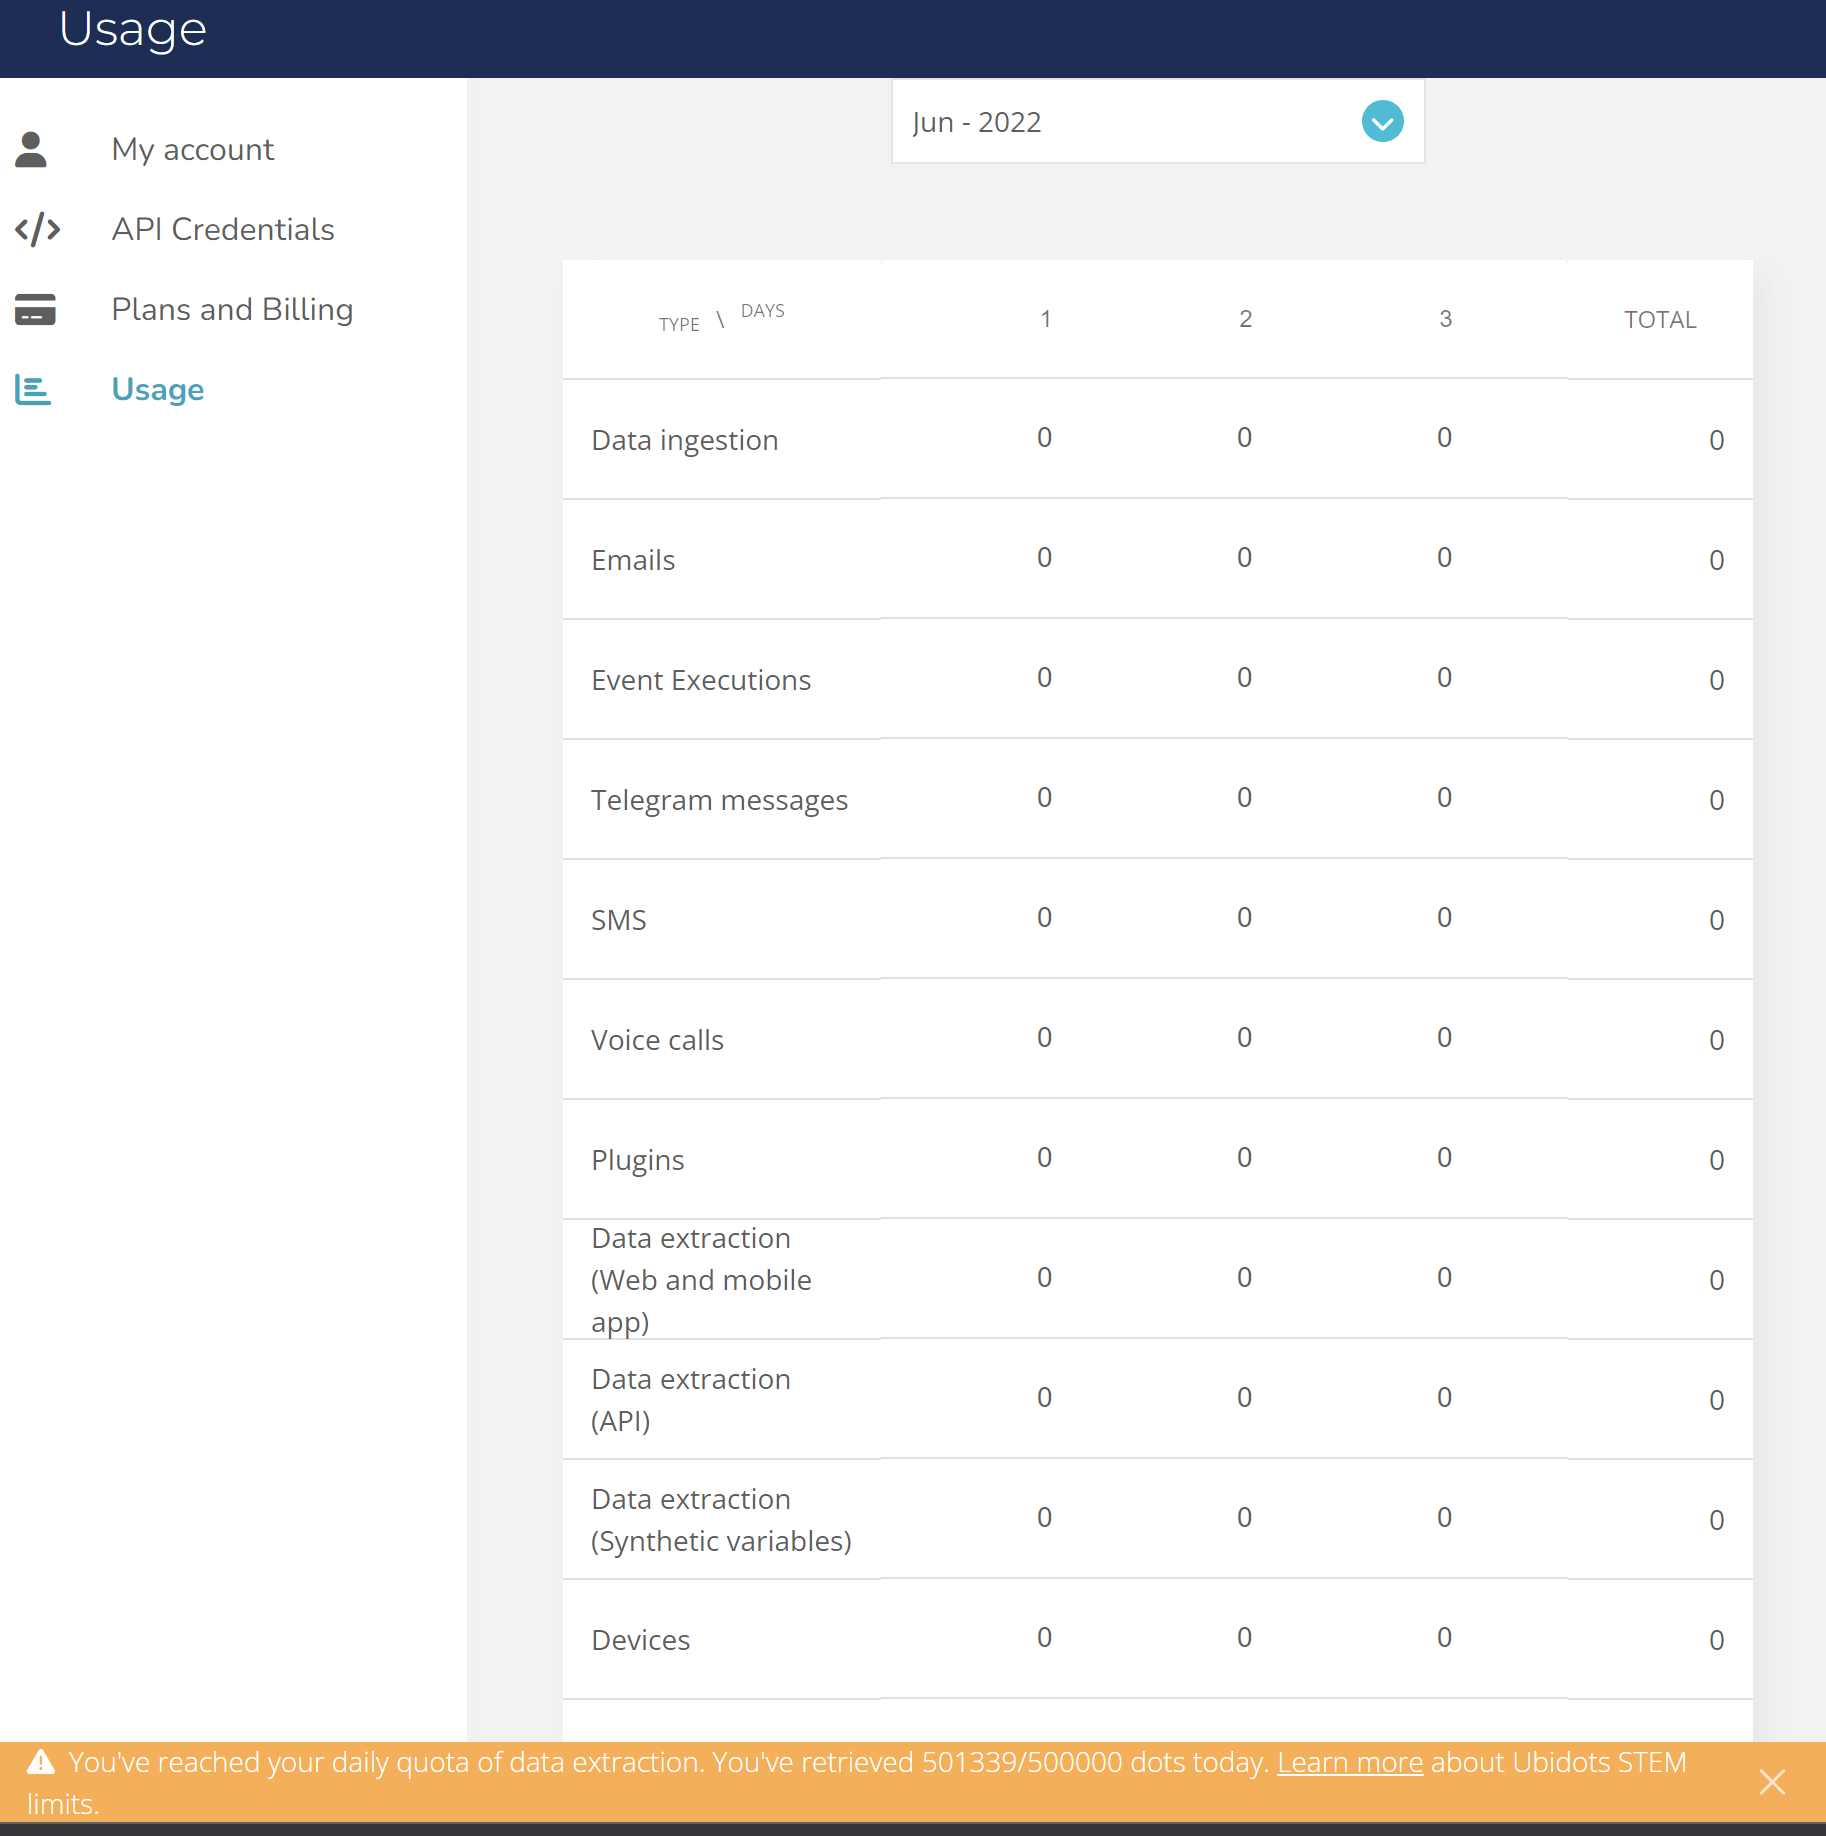
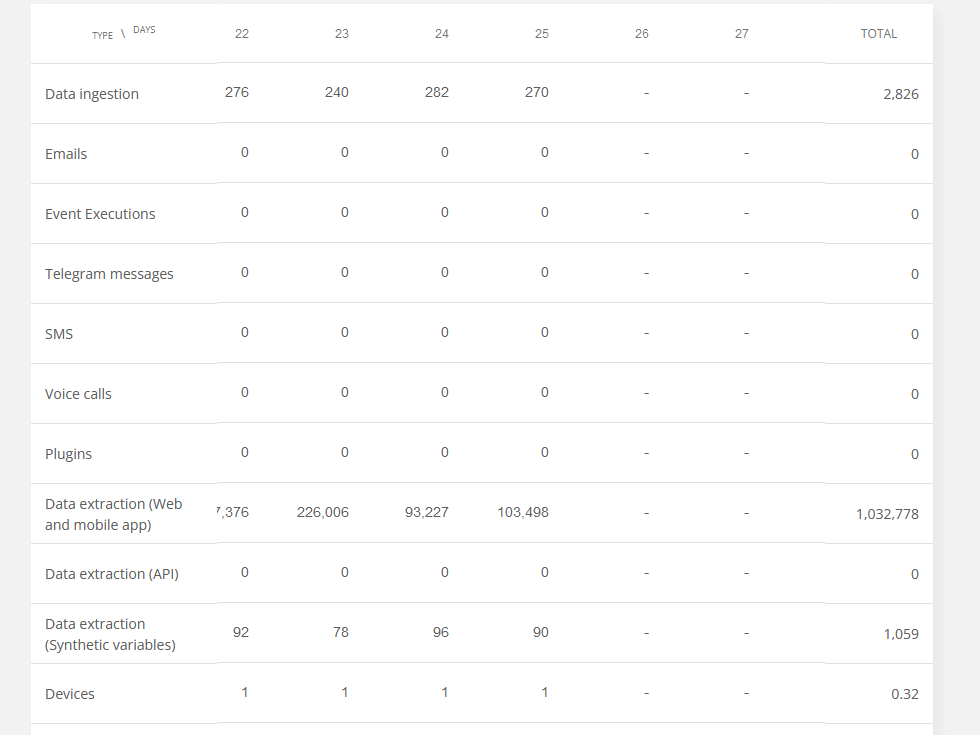
The usage page was showing zero for ingestion and extractions for this period- except for my events when kept running . The device was uploading as usual though.
In desperation, I’ve now deleted my dashboard to see if that helps.
Lo and behold, I can now inspect all the historic variable data once again.
I’ve rebuilt a simple dashboard and all now works.
So deleting and recreating the dashboard worked for me.
Peter