Like many, I’m a brewer and I have an iSpindel.
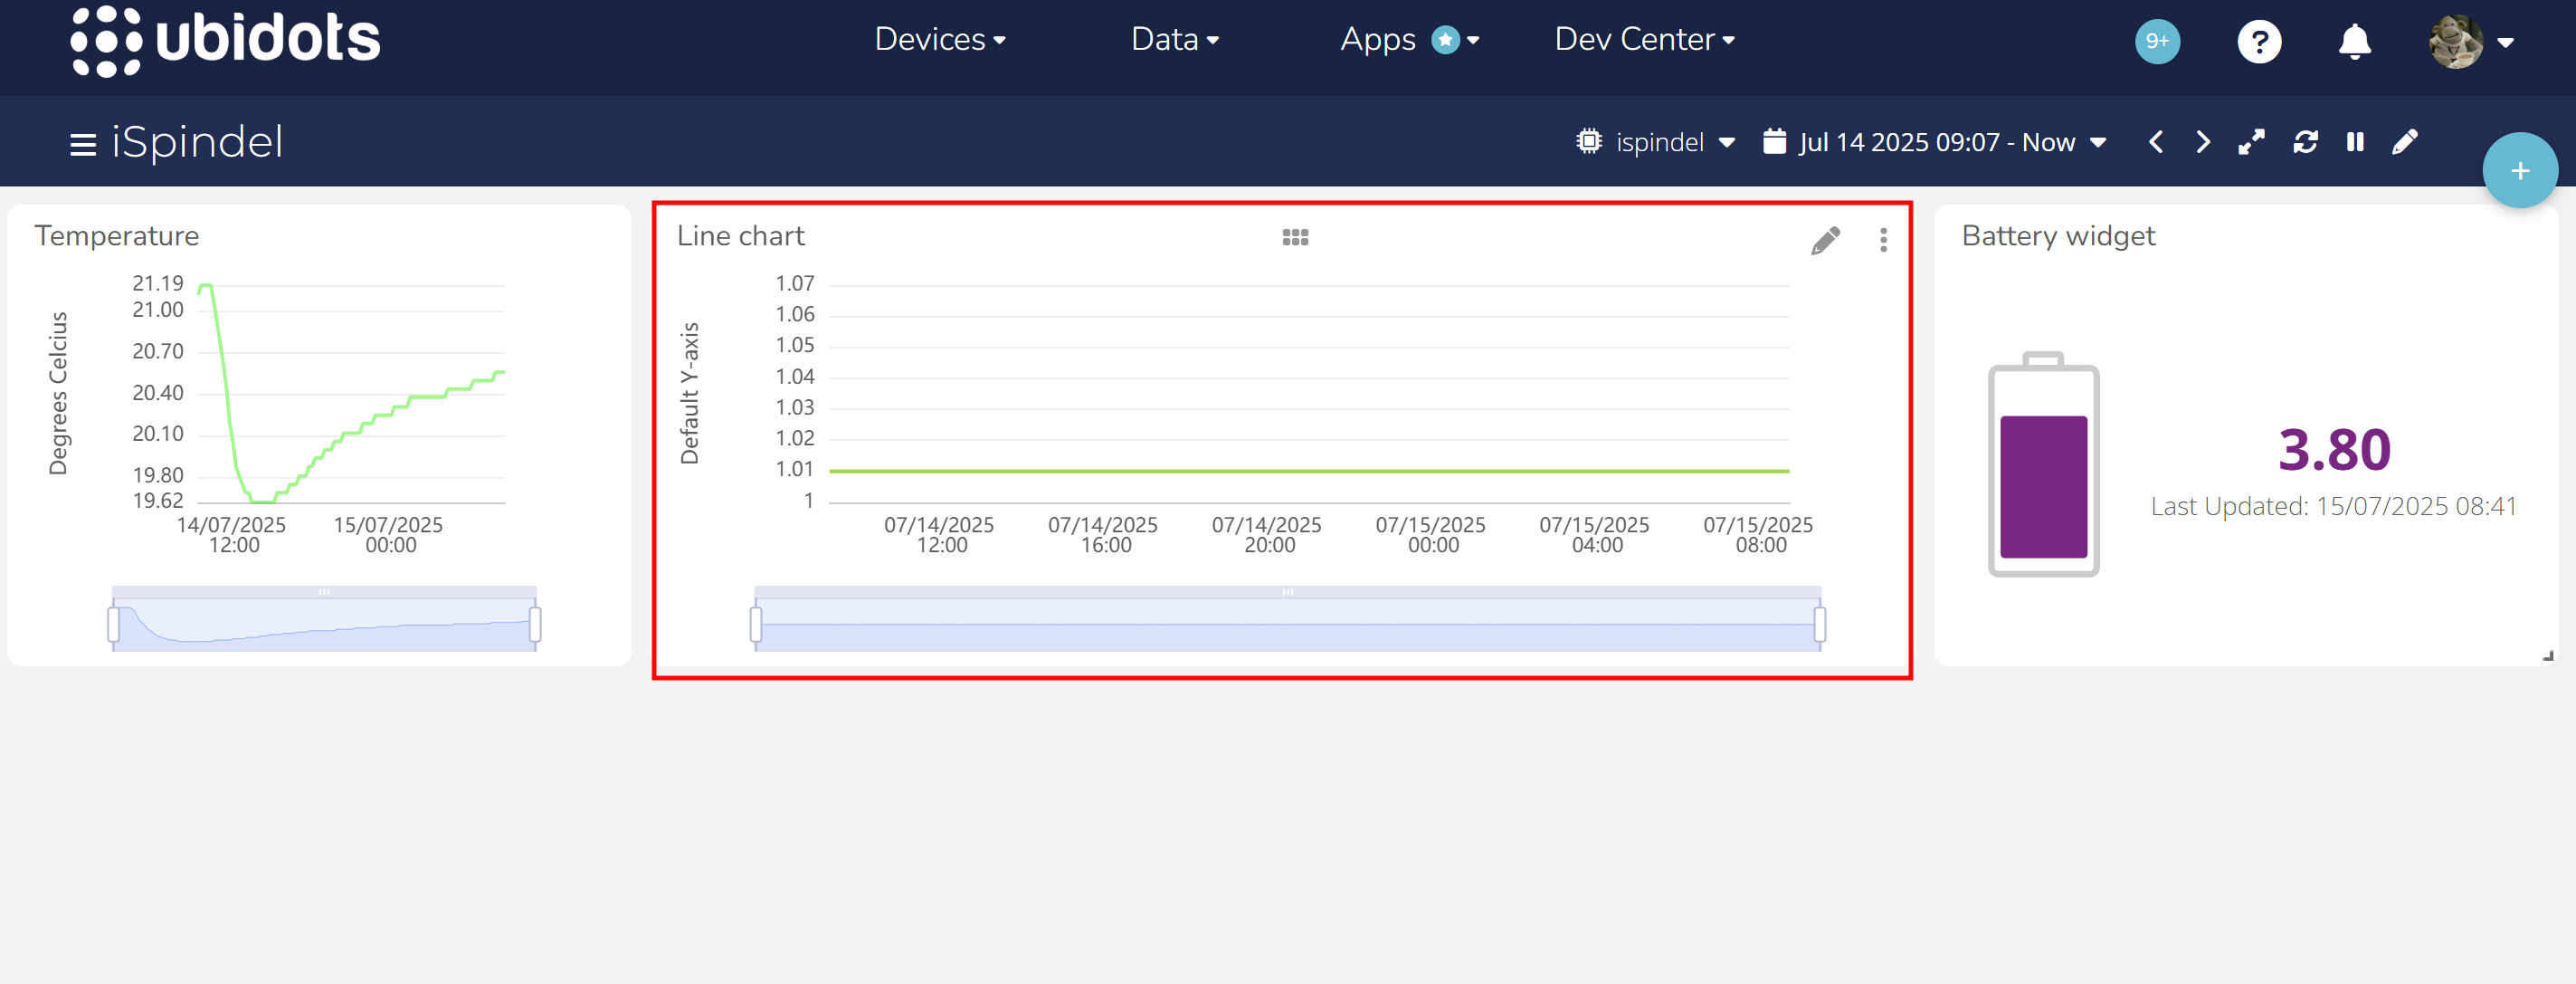
It works great, except my dashboard has stopped showing me decimal places for Gravity. So for instance, if the gravity is 1.51, it’ll just show me 1.5. Which isn’t helpful once the yeast kicks in. I have the graph set to 4 decimal places, but it refuses to show me any more than 1.
I found somewhere the raw data that was being fed in, and it was definitely to 2 decimal places.
Is there something I should be resetting?
Hello @theotherstu
I’m Alejandro from the Ubidots Customer Success team. Could you please share with me your username or account email to check the problem?
Alejandro
Hi Stu,
From a fellow brewer with iSpindels and I have been using them 3+ years.
All my iSpindels report Specific Gravity to 3 decimal places so the fermentation process can be accurately followed so you know when it is finished. So for each reduction in SG of 0.001 equates to an increase in ABV % of 0.131.
So it is well worthwhile recording SG to 3 decimals places.
My iSpindels came from Stuart of AssetSolutions .co .uk and he fully calibrates them and sets them up for you in Ubidots so it is really easy for me.
I hope you get your problem solved. Good luck!
Hi, I didn’t get an email notification about this! Apologies.
Username is theotherstu
Thanks Jeff, I did the same.
Yes, I had no problems initially. This has changed recently and I don’t understand why.
I’m using Chrome, Firefox and the app.
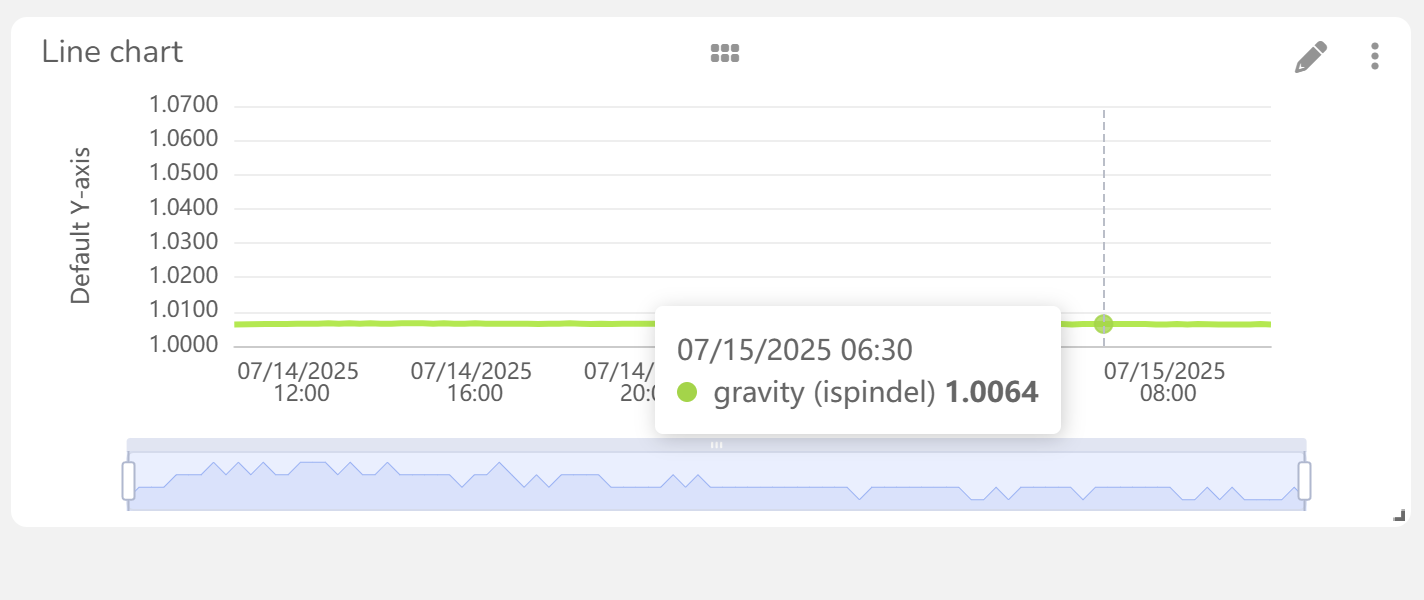
@theotherstu I’m seeing two decimal places on the Gravity Line Chart, as expected. What issue are you seeing?
Apologies, I would have expected to see 4 decimal places.
My device is setup to export to 4.
So the actual gravity is 1.012.
@theotherstu the issue is that the Line Chart is pulling values directly from the variable, so even if the widget is configured to display 4 or more decimal places, the data will still show only 2, because that’s how the values are stored in the variable itself.
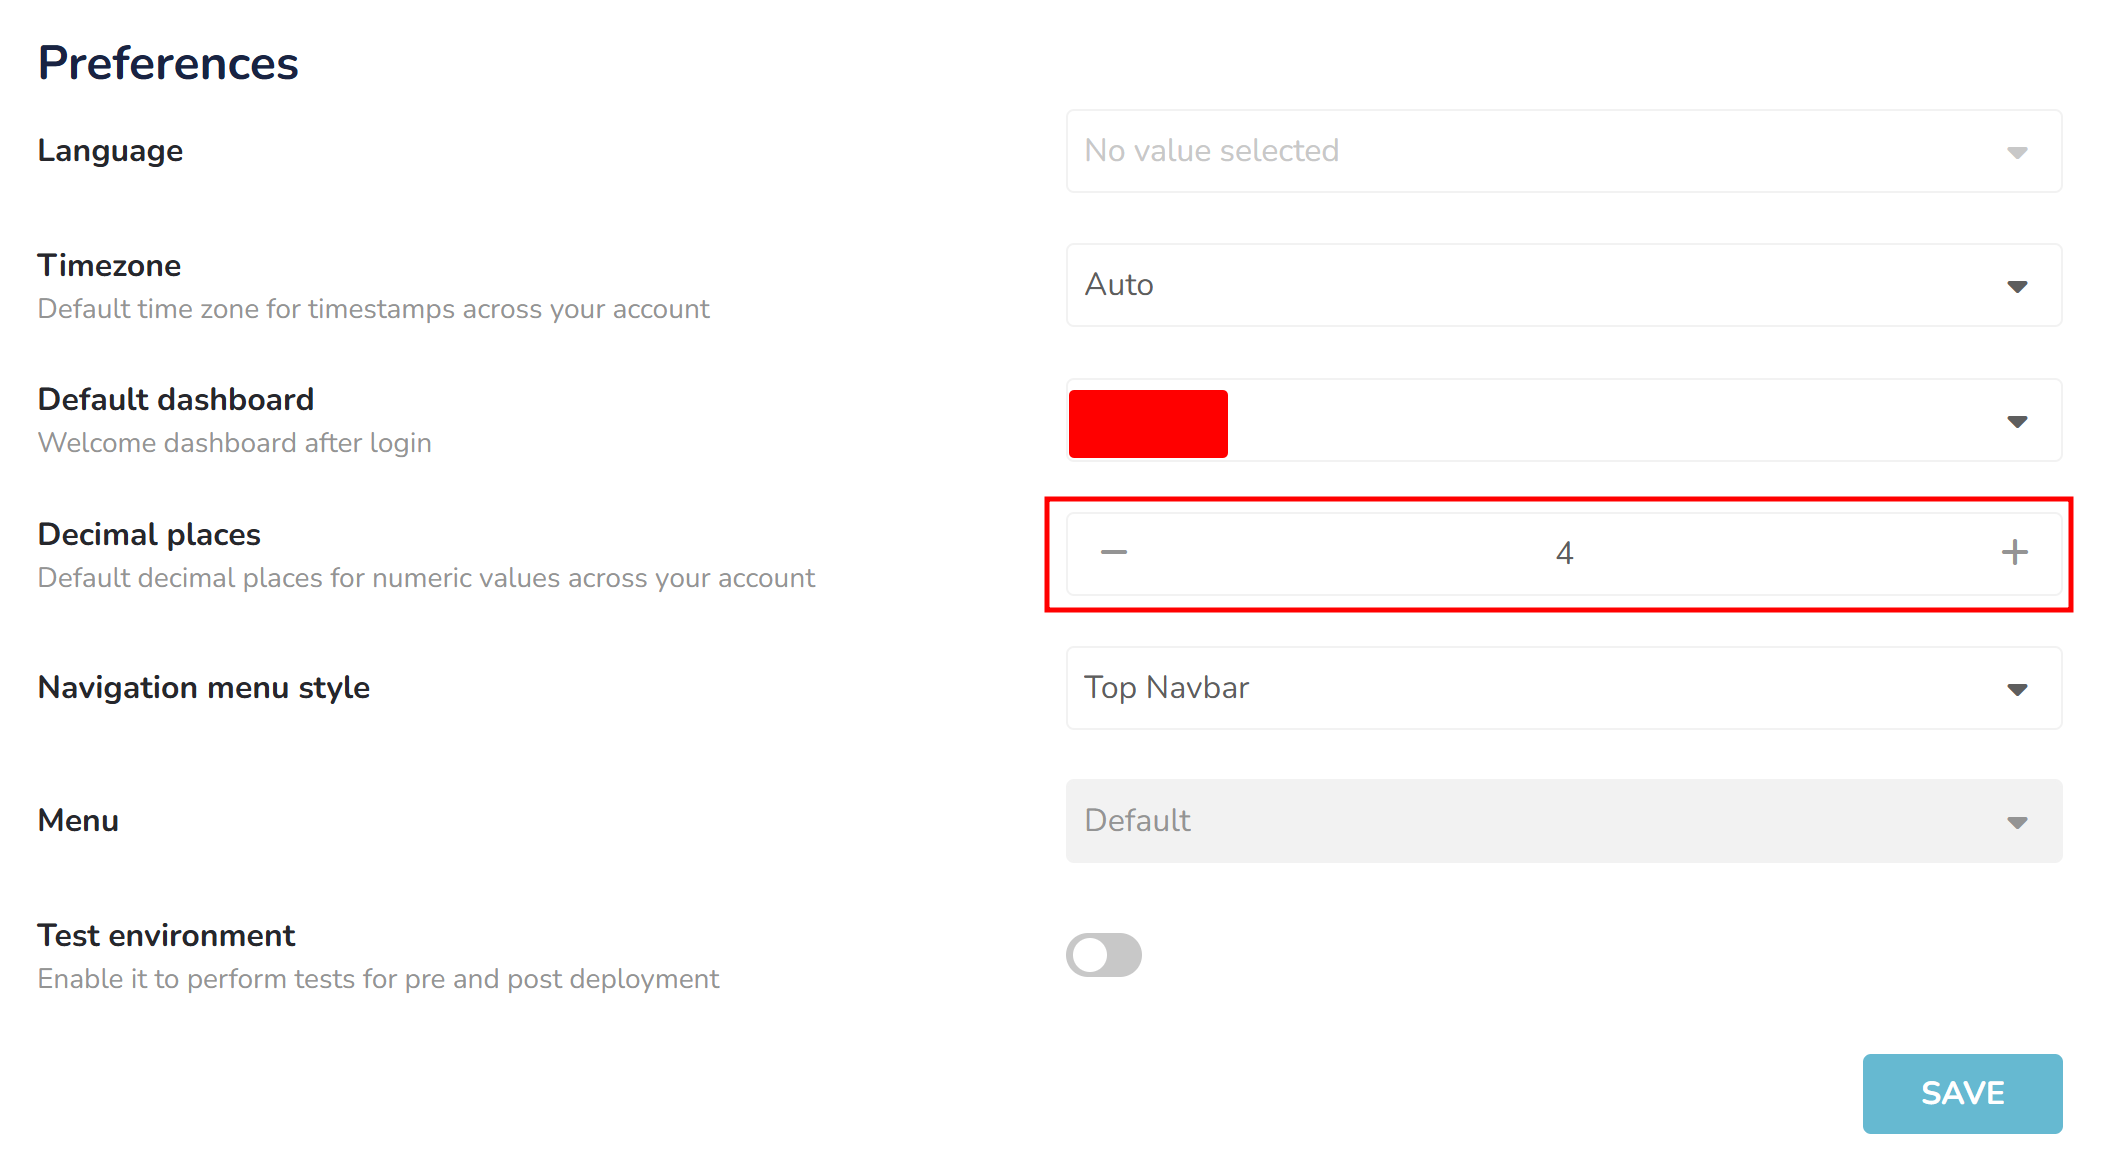
To change this, you’ll need to update the default number of decimal places in your account’s profile preferences.
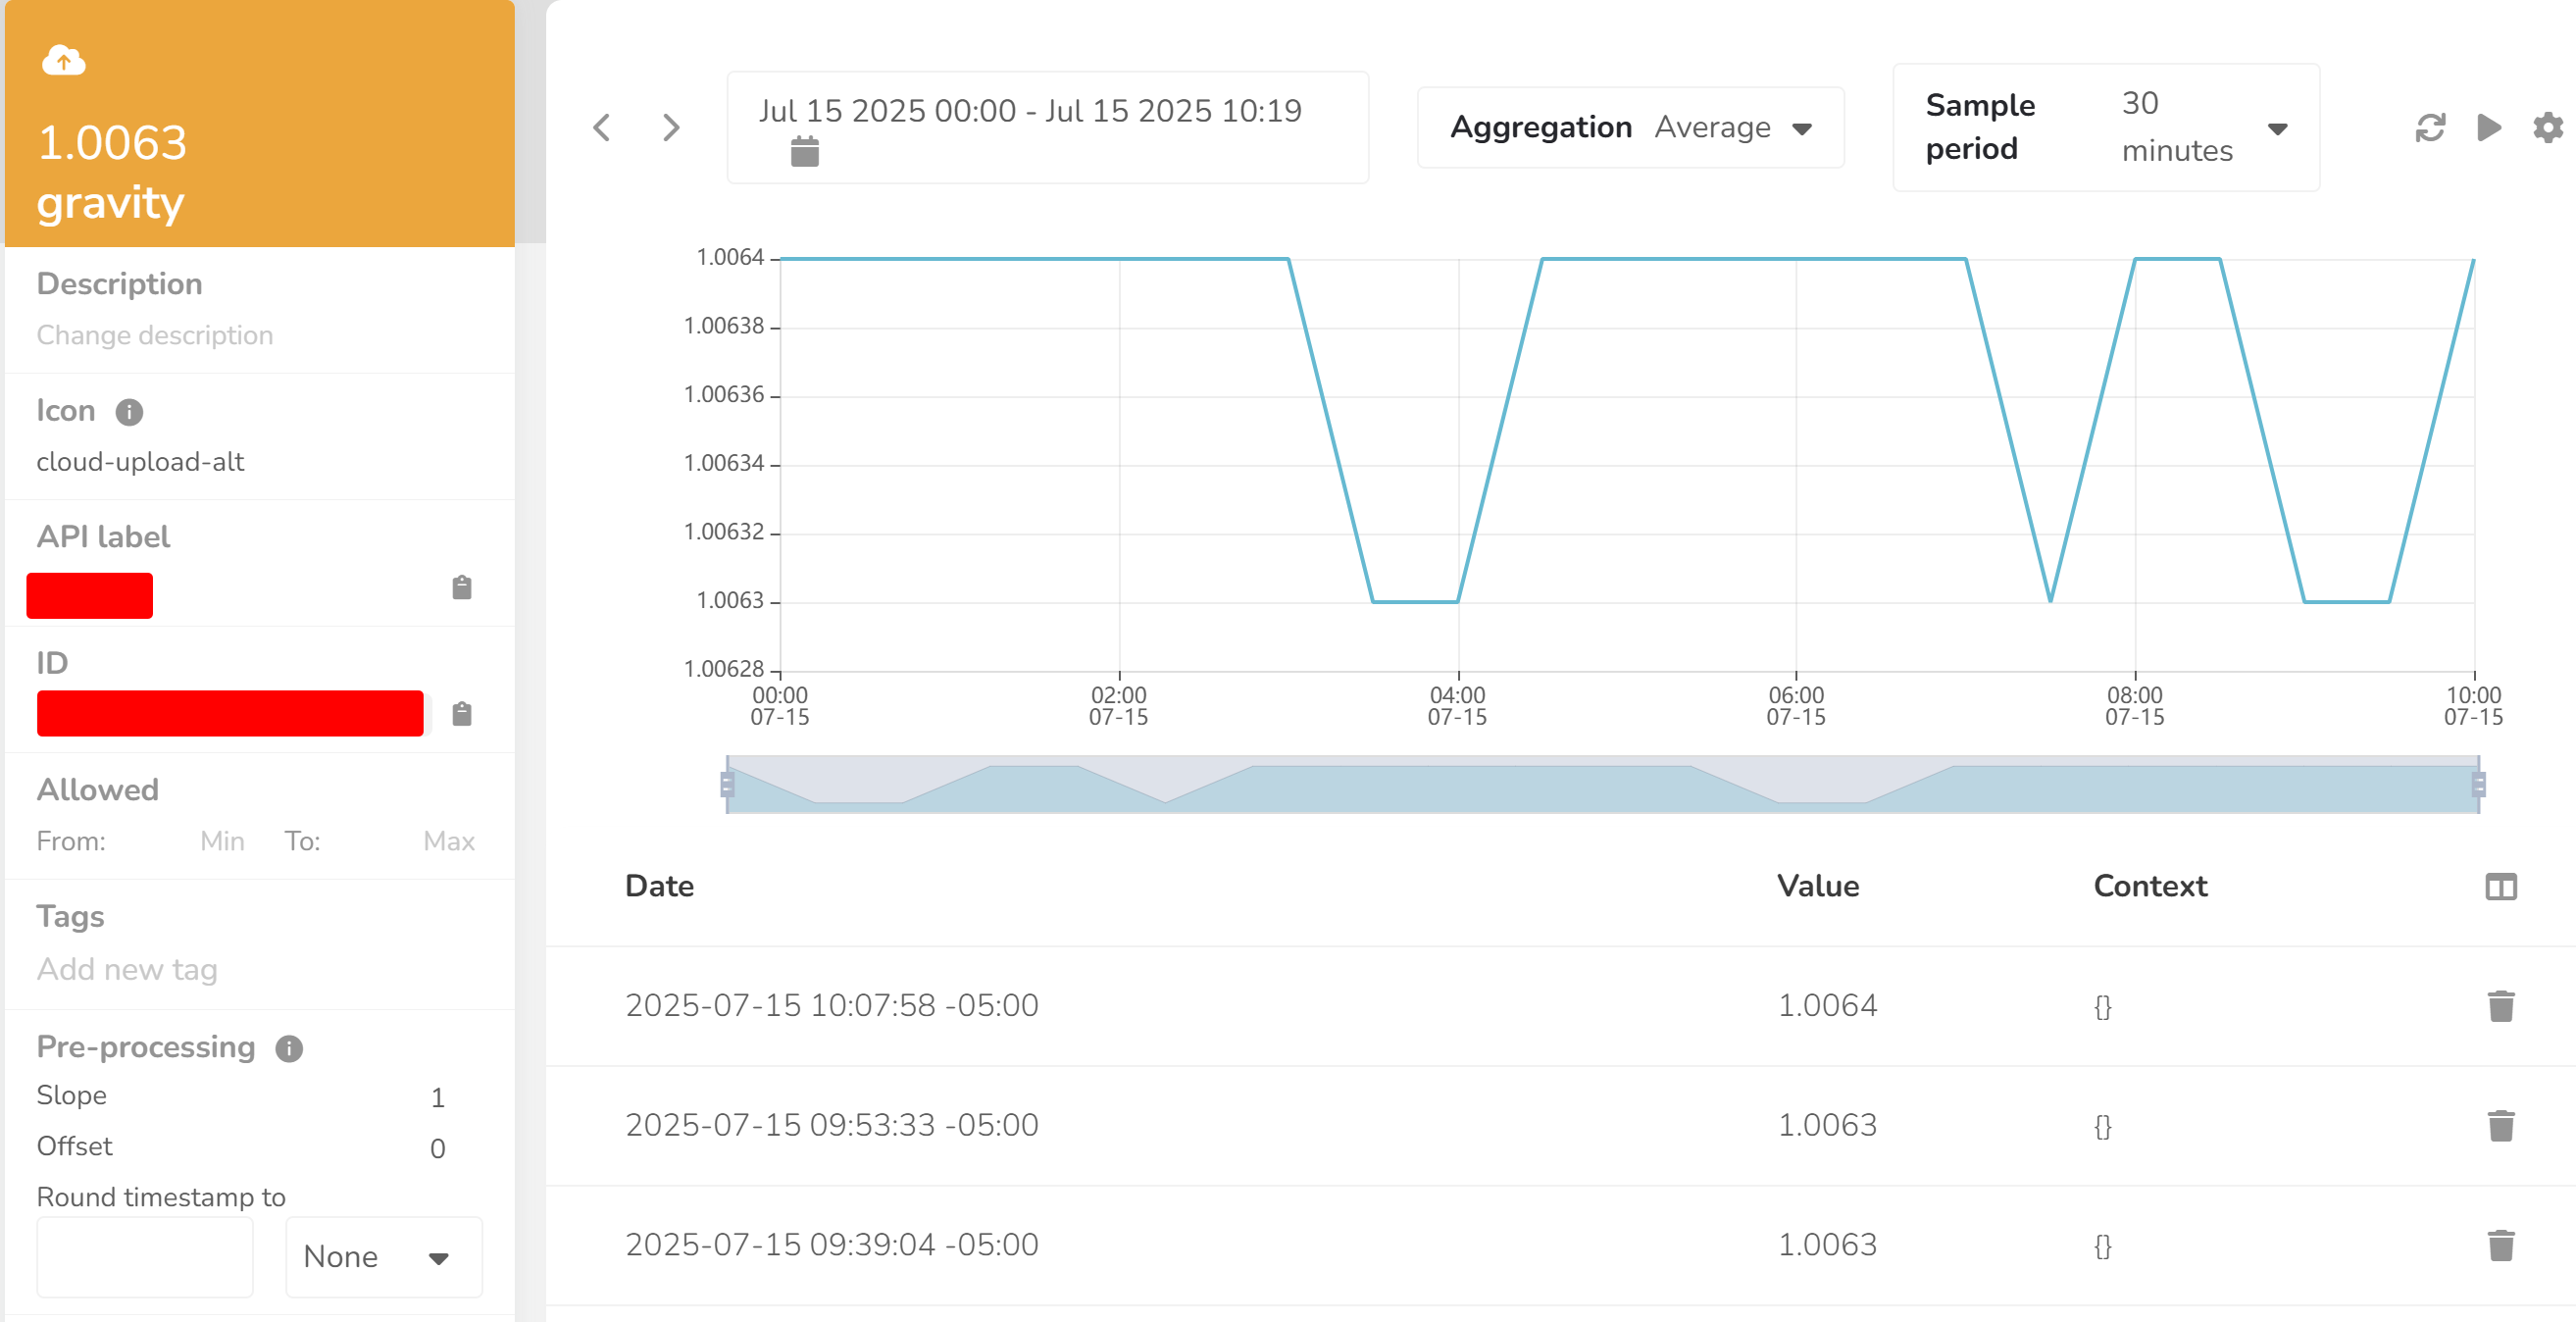
This will update the variable to display the 4 decimal places you’ve configured.
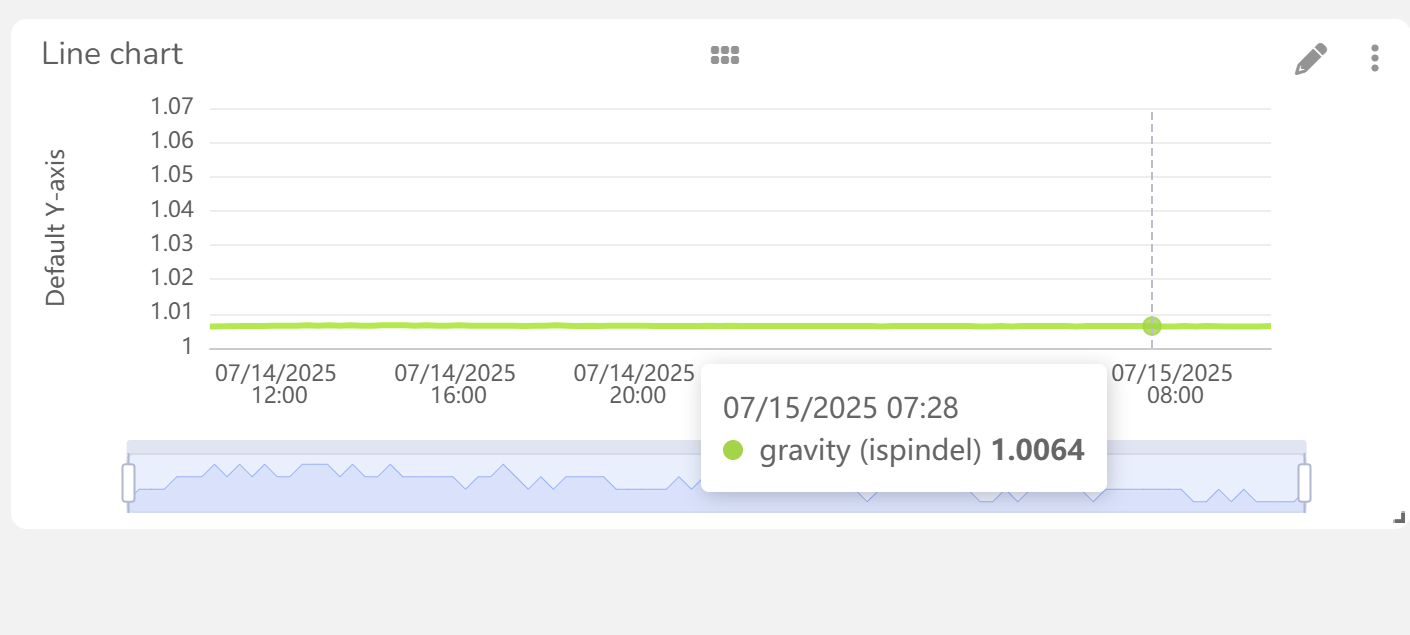
The Line Chart will now display the data with the specified 4 decimal places.
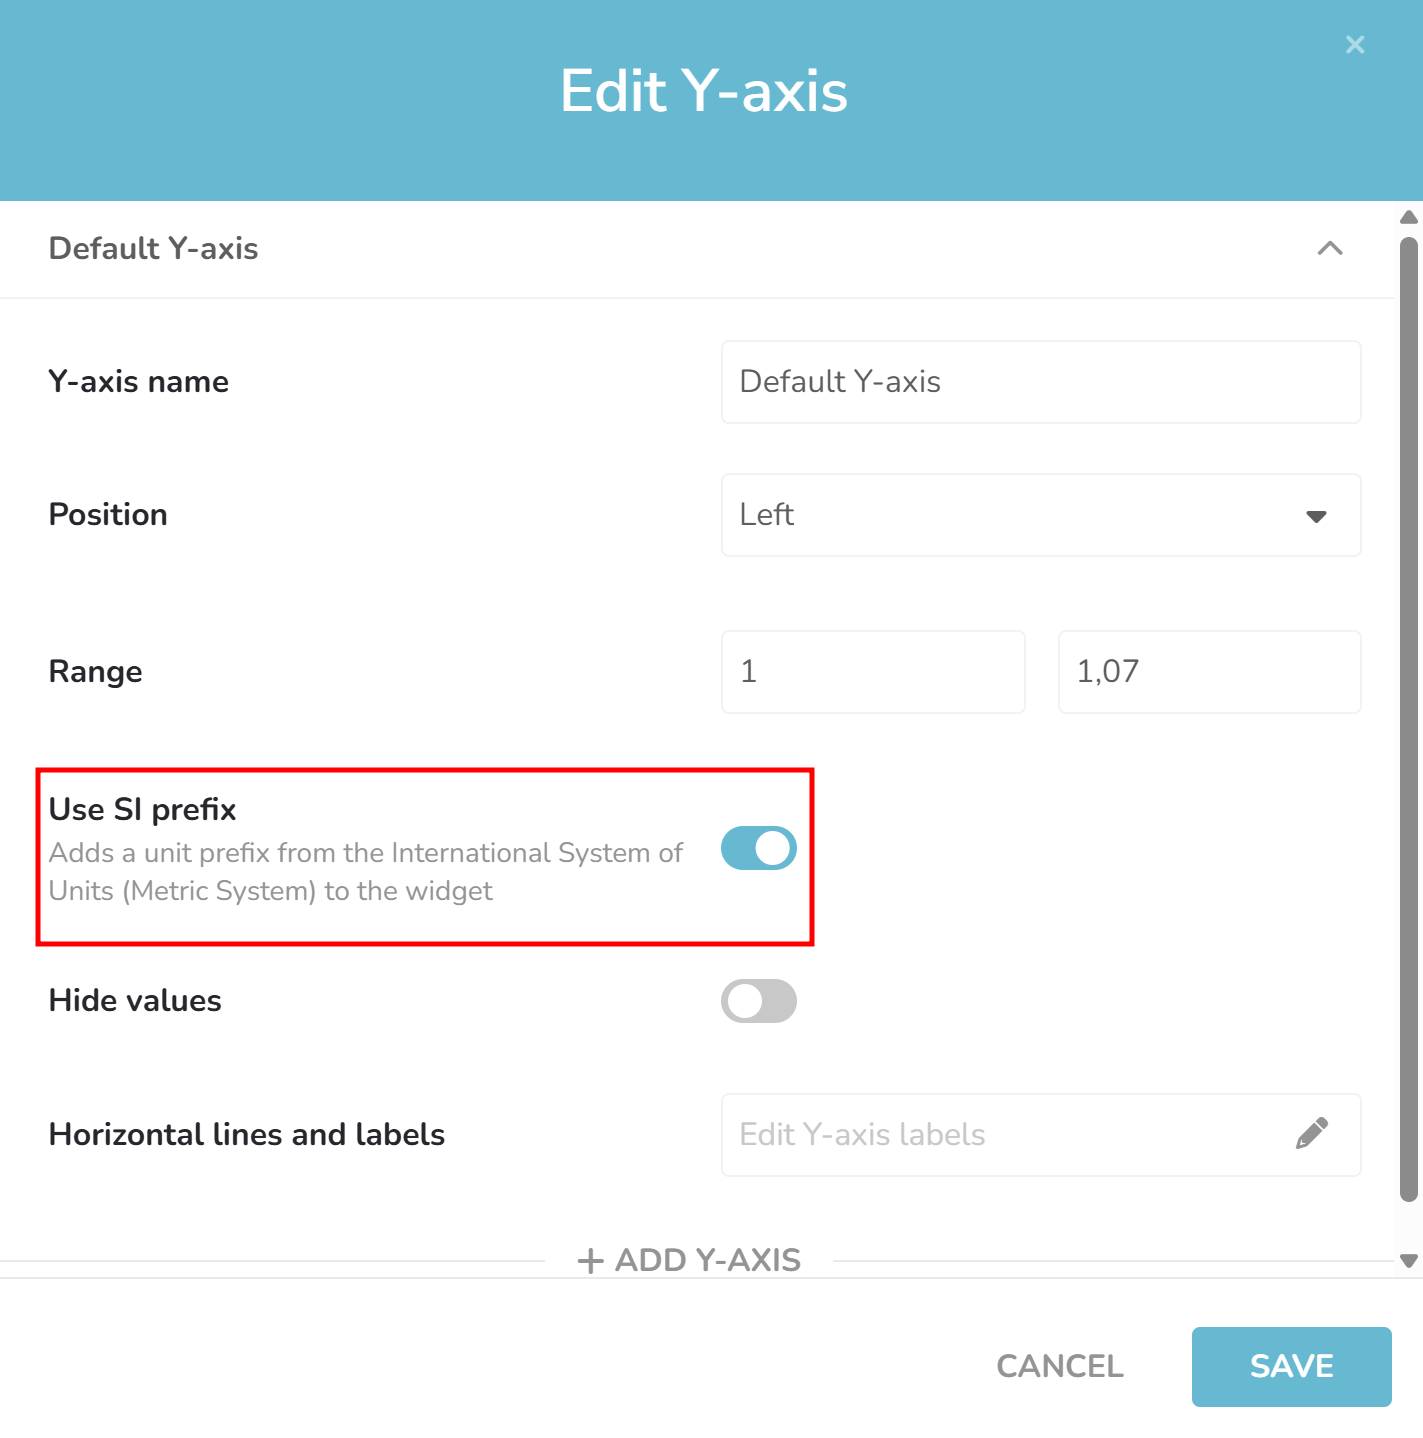
The Y-axis still shows only 2 decimal places because the SI prefix is enabled. Disabling it will allow all 4 decimal places to be displayed.
Thank you for both doing it and explaining it. Very comprehensive and it’s now working perfectly.
I’m a very happy brewer!