Is it possible to add a dynamic label in Double Axis Charts ? I think you can only set a fixed value for all devices on the dynamic dashboard . Any help?
Hello @alcos ,
I hope you’re doing well.
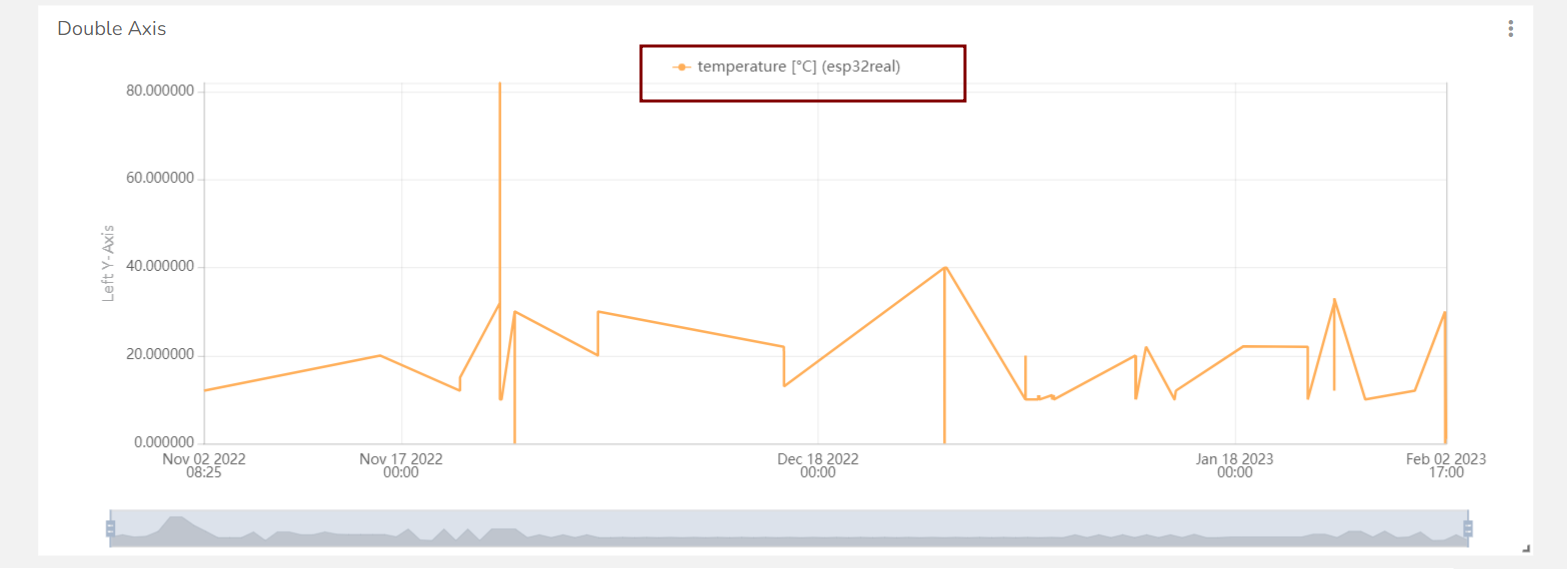
It’s not possible to add a dynamic label in the double-axis charts, as you mentioned is only possible to set fixed values for all the devices. However, it’s possible to enable the legend in your chart as seen below.
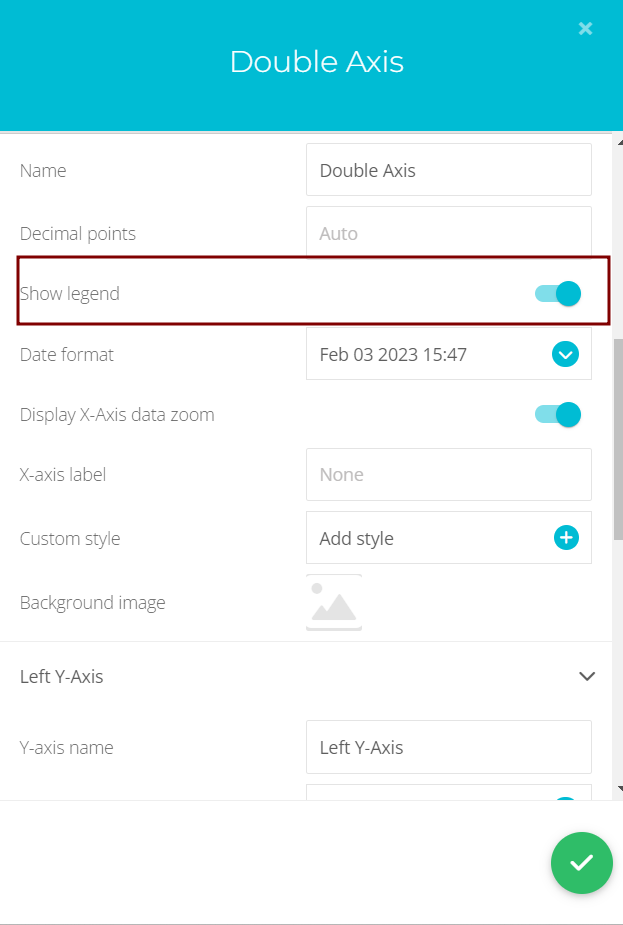
With this configuration, if you change the device of your dashboard, the name of the device will appear in the legend of the double-axis chart.
At last, I’d like to know more about your needs, so could you help me to describe why do you want to have a dynamic label depending on your device? Do you need to change this label depending on the units of your device?
Best Regards,
– Leonardo
Hi , my double axis chart shows a water level…every tank has a different overflow level threshold. I just want to draw in the same chart, the level and the threshold (device depending).
Hi, I have the same issue/request. Thresholds (y-axis labels) are important for our application so the user can differentiate what is good vs bad. We also are moving to dynamic dashboards for scaling and easier maintenance of one dashboard. I know this isn’t possible right now, but I think it is a great feature request. If events can have dynamic thresholds, line charts should, too.
Hello Taylor,
I hope this message finds you well.
Thank you for your feedback. I will pass your comments along to the Product team so they can analyze the possibility of including this in our roadmap.
I will keep you updated.
Alejandro
1 Like