Hi, over the last few days, my dashboard will not display any data. I am getting the statemen “No Data Found. There seems to be no data to visualize in the date range you have selected”. I have not made any changes to my ESP8266 programming and looking at the Devices on the web page they are sending data and it is being received by Ubidots. I don’t think I have done anything different at my end to warrant this issue. Also, the graph does have a problem updating when “Realtime” is selected.
This and last week, our DB cluster was presenting latencies at certain times of the day and that’s why sometime times, you were getting that statement in the widgets.
For a complete report and update, I recommend referring to Ubidots Status Page, which includes details and steps moving forward.
Thanks for the update. I can wait to see if it improves, however, whilst I experienced delays in updates last week, now it does not pull up any data no matter how many times I try. I get an almost instant response there is no data to display. I can try to get data more than 10 times a day and still the same response. Is this the same issue?
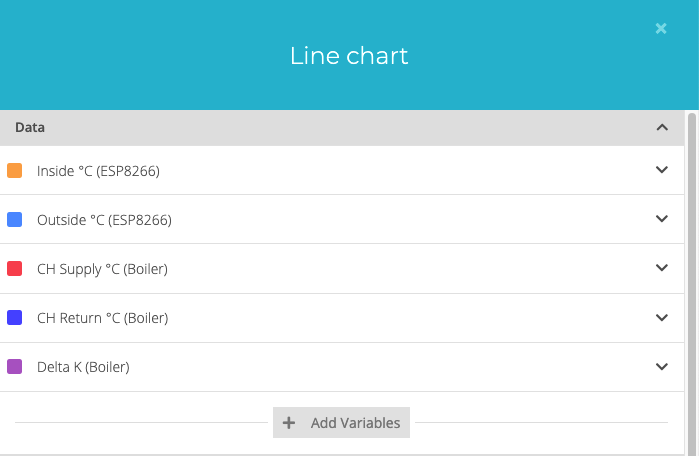
I think your problem now is that your line chart widget isn’t configured properly. I go and inspect the variables set up in it (image below), none of them have data:
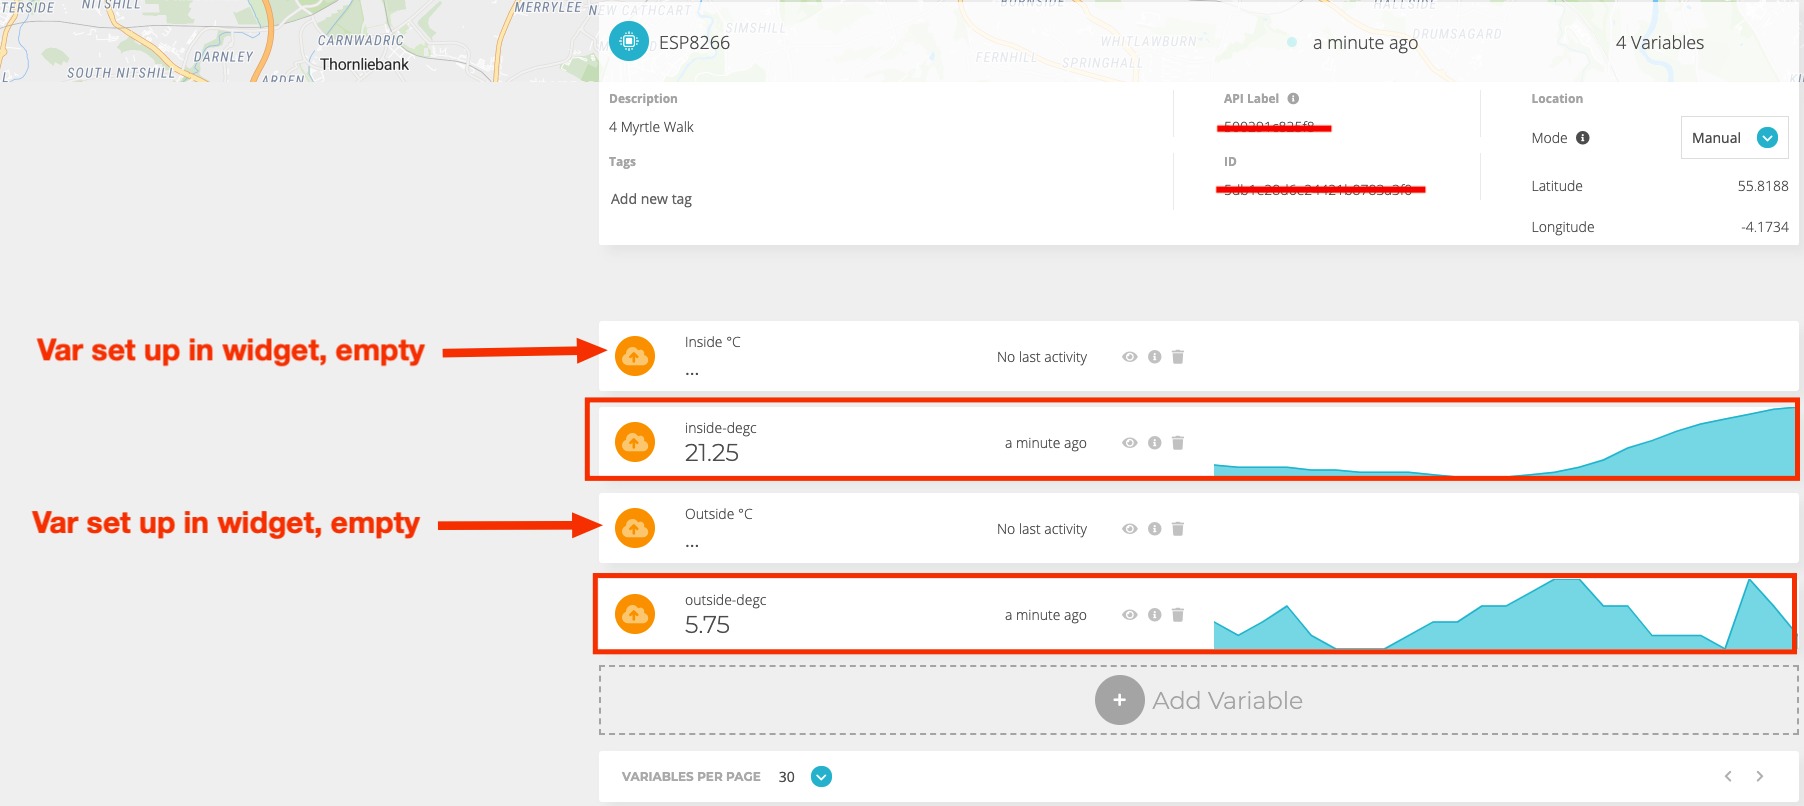
Now, watching your 2 devices, ESP8266 and Boiler, it seems that at some point, you changed the variable labels in your code or within Ubidots (I can’t say) and that’s causing data to flow to variables different than those set up in the widget.
Wow! I do not understand how that could have happened at all! I created this chart a long time ago and have never changed it. Also, I have not updated my ESP8266 devices either. I cannot understand how it was working before and stopped working recently. However I have made the changes and all is well but I am still left wondering how this could have happened. Could it be that by looking into the details of the graph it was updated in the background that I was not aware of? Whatever the reason, I remain spooked about how it changed but it is all working now. Thank you for your help with this.