Hi, there.
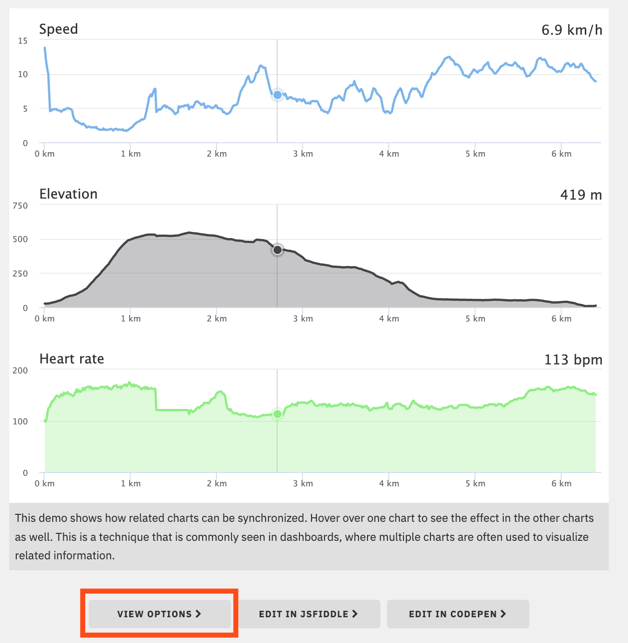
I saw the thread of reading two variables and wanted to create a synchronized chart. However, I am stuck in the place where I created a single graph with two lines. I wonder how to separate like those in the example. Is there any setting I should modify?
Here include the program that I have modified based on the motivation.
seriesOptions = [];
var seriesCounter = 0
var names = [VARIABLE1, VARIABLE2];
//var names = [TEMP1, TEMP2, TEMP3, TEMP4, TEMP5, TEMP6];
var nicenames = ['VARIABLE1', 'VARIABLE2'];
//var nicenames = ['TEMP1', 'TEMP2', 'TEMP3', 'TEMP4', 'TEMP5', 'TEMP6'];

function getDataFromVariable(variable, token, callback) {
  var url = 'https://industrial.api.ubidots.com/api/v1.6/variables/' + variable + '/values';
  var headers = {
    'X-Auth-Token': token,
    'Content-Type': 'application/json'
  };

  $.ajax({
    url: url,
    method: 'GET',
    headers: headers,
    success: function(res) {
      callback(res.results);
    }
  });
}

function createChart() {
  var chart = Highcharts.chart('container', {
    chart: {
      marginLeft: 40, // Keep all charts left aligned
      spacingTop: 20,
      spacingBottom: 20
    },
    title: {
      //text: dataset.name,
      align: 'left',
      margin: 0,
      x: 30
    },
    credits: {
      enabled: false
    },
    legend: {
      enabled: false
    },
    xAxis: {
      crosshair: true,
      events: {
        setExtremes: syncExtremes
      },
      labels: {
        format: '{value} km'
      }
    },
    yAxis: {
      title: {
        text: null
      }
    },
    tooltip: {
      positioner: function() {
        return {
          // right aligned
          x: this.chart.chartWidth - this.label.width,
          y: 10 // align to title
        };
      },
      borderWidth: 0,
      backgroundColor: 'none',
      pointFormat: '{point.y}',
      headerFormat: '',
      shadow: false,
      style: {
        fontSize: '18px'
      },
      //valueDecimals: dataset.valueDecimals
    },
    series: [{
      data: seriesOptions[0],
      name: nicenames[0],},
      {
      data: seriesOptions[1],
      name: nicenames[1]
      //type: dataset.type,
      //color: Highcharts.getOptions().colors[i],
      //fillOpacity: 0.3,
      //tooltip: {
       // valueSuffix: ' ' + dataset.unit
      //}
    }]
  });
}

// repeating function
(function() {
  // 1. Call load_seriesOptions passing a callback function,
  //    which will be called receiving the result from the async operation
  console.log("1. function called...")
  load_seriesOptions(function(result) {
    // 5. Received the result from the async function,
    //    now do whatever you want with it:
    //console.log("5. result is: ", result);
    console.log("5. result received");
    /* 		if (chart) {
    			chart.destroy();
    			chart = undefined;
    		  } */
    createChart()
  });
  setTimeout(arguments.callee, 60000);
})();

function load_seriesOptions(callback) {
  console.log("2. callback here is the function passed as argument above...")
  // 3. Start async operation:

  seriesOptions = [];
  for (var fieldIndex = 0; fieldIndex < names.length; fieldIndex++) {
    var name = names[fieldIndex];
    getDataFromVariable(name, TOKEN, function (values) {
      console.log("3. start async operation...");
      var data = values.map(function(value) {
        return [value.timestamp, value.value];
      });
      console.log(data)
      seriesOptions.push(data); //1 series
      if (seriesOptions.length == names.length) {
        console.log("4. finished async operation, calling the callback, passing the result...")
        // 4. Finished async operation,
        //    call the callback passing the result as argument
        callback(seriesOptions);
      };
    });
  };
}

/**
 * In order to synchronize tooltips and crosshairs, override the
 * built-in events with handlers defined on the parent element.
 */
['mousemove', 'touchmove', 'touchstart'].forEach(function(eventType) {
  document.getElementById('container').addEventListener(
    eventType,
    function(e) {
      var chart,
        point,
        i,
        event;

      for (i = 0; i < Highcharts.charts.length; i = i + 1) {
        chart = Highcharts.charts[i];
        // Find coordinates within the chart
        event = chart.pointer.normalize(e);
        // Get the hovered point
        point = chart.series[0].searchPoint(event, true);

        if (point) {
          point.highlight(e);
        }
      }
    }
  );
});

/**
 * Override the reset function, we don't need to hide the tooltips and
 * crosshairs.
 */
Highcharts.Pointer.prototype.reset = function() {
  return undefined;
};

/**
 * Highlight a point by showing tooltip, setting hover state and draw crosshair
 */
Highcharts.Point.prototype.highlight = function(event) {
  event = this.series.chart.pointer.normalize(event);
  this.onMouseOver(); // Show the hover marker
  this.series.chart.tooltip.refresh(this); // Show the tooltip
  this.series.chart.xAxis[0].drawCrosshair(event, this); // Show the crosshair
};

/**
 * Synchronize zooming through the setExtremes event handler.
 */
function syncExtremes(e) {
  var thisChart = this.chart;

  if (e.trigger !== 'syncExtremes') { // Prevent feedback loop
    Highcharts.each(Highcharts.charts, function(chart) {
      if (chart !== thisChart) {
        if (chart.xAxis[0].setExtremes) { // It is null while updating
          chart.xAxis[0].setExtremes(
            e.min,
            e.max,
            undefined,
            false, {
              trigger: 'syncExtremes'
            }
          );
        }
      }
    });
  }
}