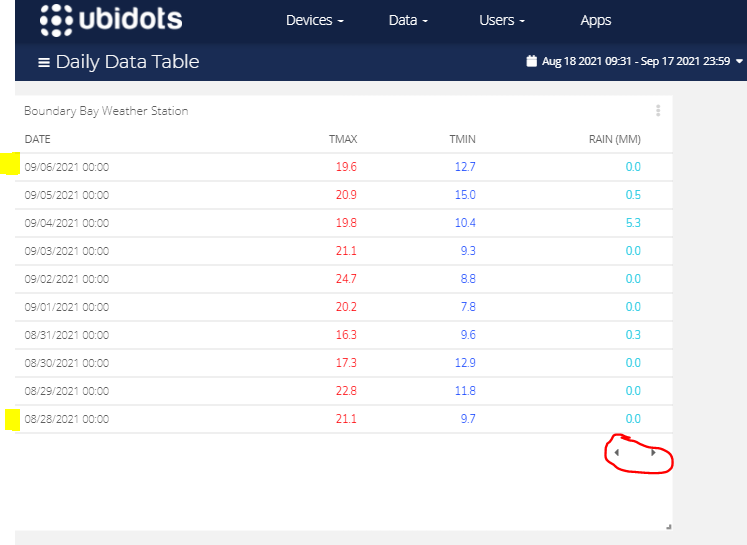
Here’s an interesting one… I’ve setup a values table widget in my dashboard to show daily summaries (max, min, sum). It works fine.
When I set a date range to something like “Last 30 Days”, it shows a maximum of 10 rows (days) at a time.
Note in screenshot the dates are 9/8 to 9/17.
When I click the forward button to move to the next 10 rows, it shows 8/28 to 9/6. For some reason, 9/7 is missing.
Although I was able to reproduce this issue when you reported it, after reviewing it with one of our Developers it doesn’t seem to happen anymore. Could you please confirm that this issue has been solved for you?
Hi Sebastian,
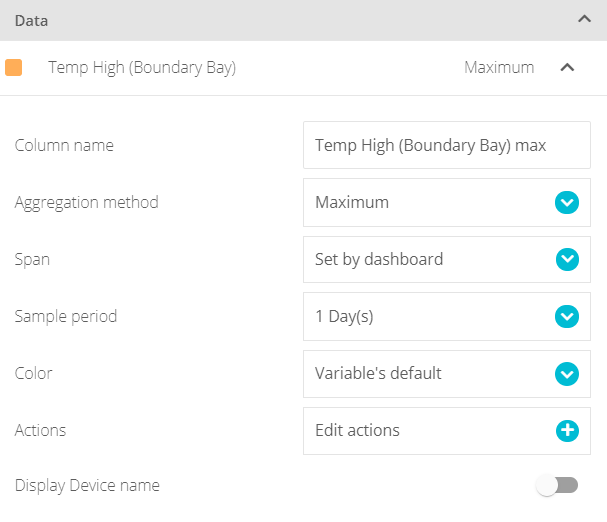
Yes, I’m still able to reproduce the issue. I just made a values table that summarizes maximum and minimum with a sample period of 1 day.
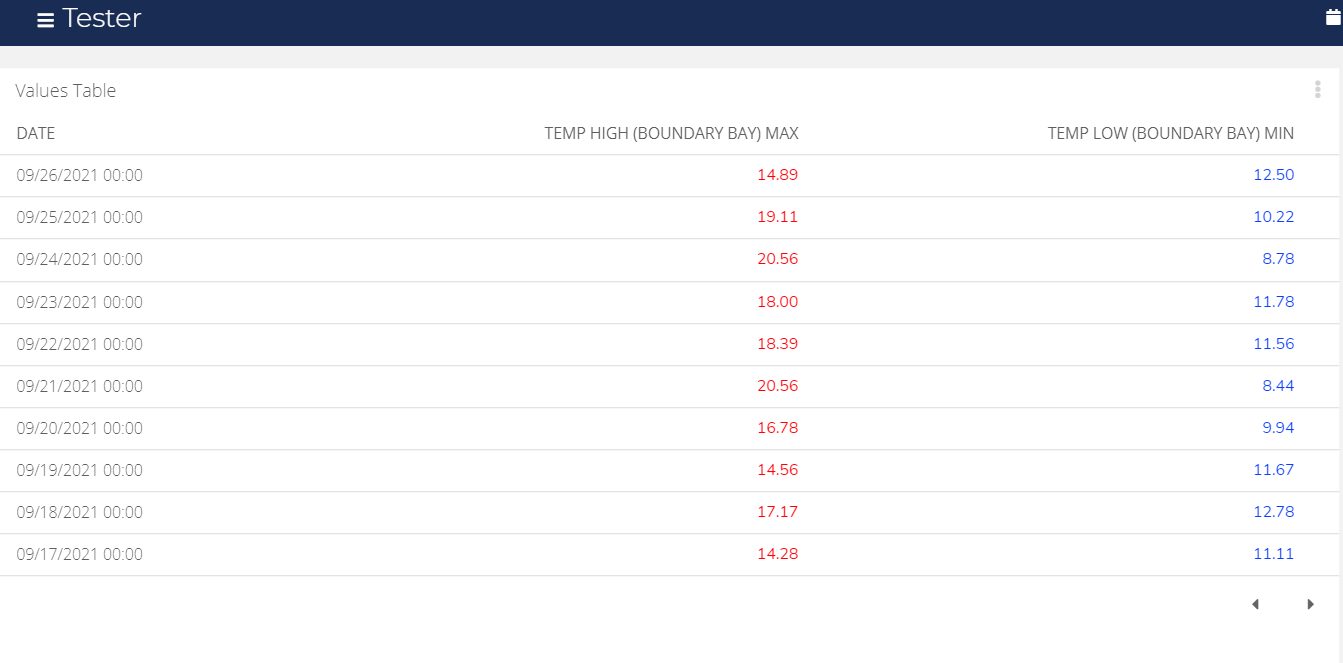
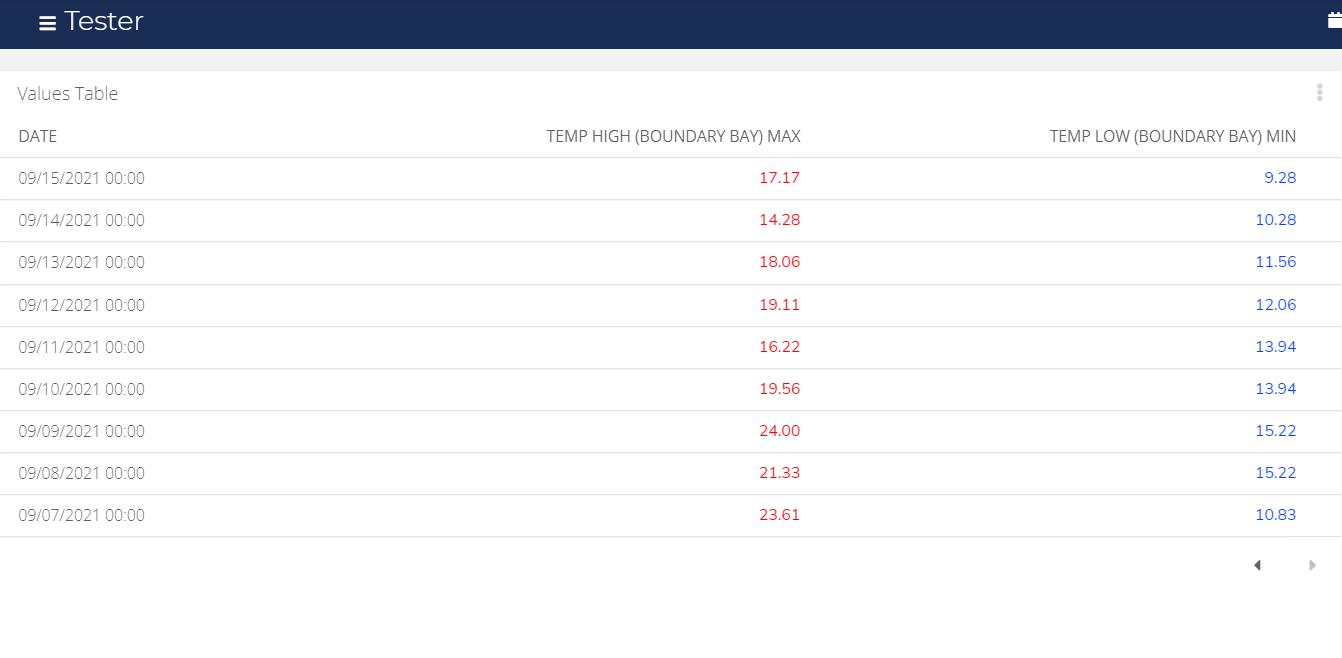
When I select a date range (using quick range) of the past 30 days, the table shows 9/28 - 10/7, the next shows 9/17 - 9/26, and the next is 9/7 - 9/15. In this case, 9/27 and 9/16 are still missing.