I’ve reported this issue earlier in the year (February) but the problem still exists. My dashboard displays the input from five variables captured on esp826 devices in a line graph format. Data is captures (I think) every two minutes. The data upload is within the 24 hour allowance. I usually display the graph with the horizontal axis based on the last 24 hours and have it update in real time.
However, if I have not viewed it for a couple of days and then try to refresh the page, often it reports an error, then after a couple of attempts it says I am over my daily download allowance. My daily download allowance was increased because of this issue but it is not enough to cope with the problem of not loading the graph and using up the limit in doing so. It also has the problem of refreshing, and using the download allowance, every time you change the graph horizontal axis time frame. For instance, refreshing after a couple of days it reverts to the date of “a couple of days ago” and when tou go to chnage it to Last 24 Hours, real time display is switched off - switching it back on consumes the download allowance.
Thank you for letting us know about this situation.
We will check your problem and replicate your setup to analyze how the Dots consumption behaves, and we will get back to you to give you an answer.
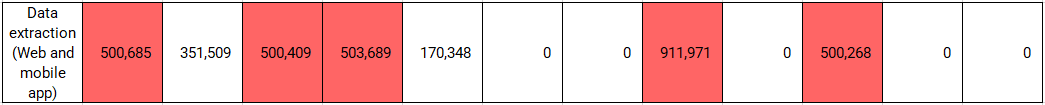
However, by reviewing your usage logs, you can see that the days highlighted in red exceeded the daily data extraction capacity of 500,000 dots per day across all of your account.
Please refer to the link below to check the limits and capacity of a STEM account, but we will replicate your case to see if simulating the same situation we also obtain this data consumption
I understand the daily limit has been exceeded however it’s not because I have “wanted” to display lots of data, I only want to see the last 24 hours which should only be a few thousands pieces of data.
I typically leave the site open on my browser, and maybe for instance refresh it after a couple of days. I have the X axis set for displaying the Last 24 hours and set for realtime update. The problem is that Last 24 hours sets the left end of the graph at 24 hours previous to when it is selected. It then refreshs the page consuming data. Then I select Realtime to keep it updating (noting that it consumes another 24 hours of data when Realtime is selected which is not right). However, as it updates it does not change the graph starting time - for instance, if I start it 08:00 in the morning by selecting Last 24 hours then start Realtime, thats two refreshs (when it should only really be one) and then as time goes, say one hour later, the left end of the graph is still at 08:00 but the right end of the graph is at 09:00, so it is not a rolling 24 hours of display. Now, if I dont look at the graph for a few days and I refresh the page, it loads data from the graph start from some days ago and loads more data then needed and then exceeds the limit.
This, I believe, would not be an issue if only the last 24 hours were displayed properly. I can perhaps circumvent this if I close the page and start logging into the site again but dont think this happens all the time.
I think it should load the data when the date range is selected, then when Realtime is selected it should only be reading in new data and ignoring any data greater then 24 hours old. If the page is ever refreshed it should only load 24 hours worth of data, not based on the original start date of the graph.
So in summary, the “last 24 hours” option for X axis is not working as it really should.
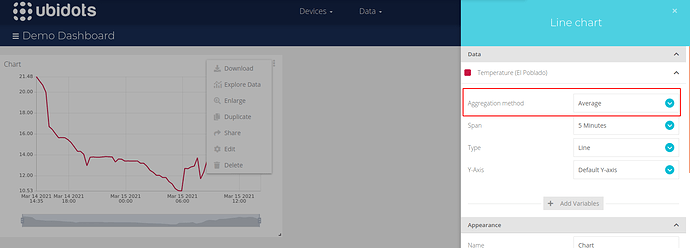
We have already replicated your scenario and we had the same problem. After analyzing it with our Dev Team we could observe that, when you leave the dashboard open with the Real Time on, there is a request that is made every 2-3 minutes that consumes all the capacity of your data extraction. We identify that this request should not be made for widgets whose aggregation method is Last Value, as in your case.
We already reported this problem but its solution may take time, so I’d suggest you close the dashboard in the meantime and refresh it when you need it, since each time you open the dashboard 3600 dots are consumed approximately, and as the maximum capacity for a STEM account is 500,000 dots, that means that you could refresh the dashboard 138 times in a day without any problem.
We’ll let you know once we have any news about this problem.
Possibly related but this is an old bug that was around about a year ago (Actually just checked and it was March this year), and I’m hitting it again today.
If you set a dashboard to auto refresh it keeps consuming dots even if you close the dashboard on all browsers. I note that the dashboard also doesn’t let me switch off “realtime” - it defaults back to realtime when I re-login and open the dashboard again.
I though it was fixed some time back but I haven’t used Ubidots in over 6 months and it looks like it’s come back again for me too.
(Actually I found the past issue - explanation was
" One of those buttons is a play and pause button that enables the real-time of the dashboard which means updating the data of the widgets based on the new data that is being received in the variables. For example, if you have the dashboard open, with the real-time enable the widget should update its values to show the new ones, which generate dots out consumption.
Now, the issue was related when the real-time option was paused and there was one widget or more with an aggregation method configured.
In this scenario, the Dashboard should not generate dots out as the real-time option is disabled which implies that the dashboard will not update based on new data. Unfortunately, consumptions were being generated in these widgets when new data was received in the variables, even though the widget did not update its value on the dashboard side. The team has already deployed a solution for this issue and we are currently monitoring its correct operation. We apologize for any confusion and inconvenience.")
Thanks for your info. The bug has certainly been around for a while and its rather annoying when you leave the browser open and refresh forgetting the issue. I have found, as suggested by Ubidots team, closing the browser and reopening is manageable. We will see if they come up with a fix.
We could already identify what was the problem with the consumption of dots out when the widget was configured to show the Last Value of the variable since, with this aggregation method, the consumption of dots out should not be so high. Our development team is working on this. However, when checking your account, I saw in your dashboard that you have some widgets with aggregation methods such as Average or Maximum, which generates more consumption of dots out and is normal. I recommend you close your dashboard when you’re not using it to reduce this consumption.
Also, about what you said of the button to switch off the Real Time, we identified checking your account that it was not working because you were trying to retrieve the data from a future time to now, which is an error. When we modified the date range to one from past time to present, it worked without any issue. Keep in mind that future data will never appear on your dashboard as this would not make sense.
Please let me know if you need help with anything else.