Hi
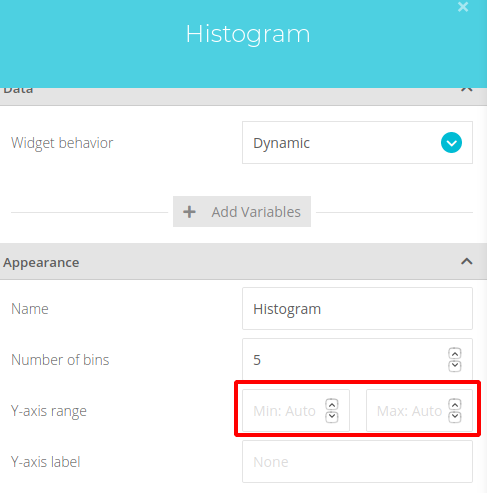
How can I adjust the range of values for a histogram graph?
For example, for a line chart where I have the x-axis the value of time, I use rangeselector: Options
var Options = {
buttons: [{
step: ‘minute’,
stepmode: ‘todate’,
count: 60,
label: ‘15 minutos’
}, {
step: ‘hour’,
stepmode: ‘backward’,
count: 4,
label: ‘1 hora’
}, {
step: ‘hour’,
stepmode: ‘todate’,
count: 24,
label: ‘1 día’
}, {
step: ‘week’,
stepmode: ‘backward’,
count: 2,
label: ‘15 días’
}, {
step: ‘all’,
label: ‘Todos’
}],
};
Thanks A lot