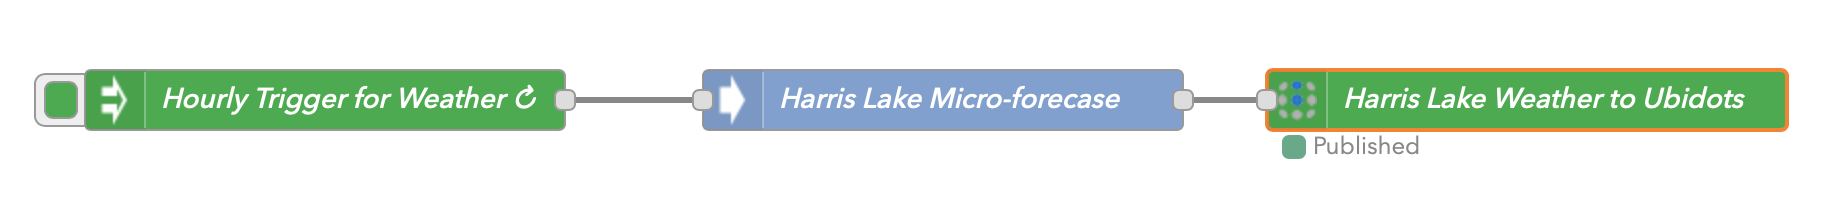
I am looking at a new service from Particle called Particle Rules Engine - which is a managed implementation of NodeRed. One of my early efforts will be to use this service to add weather data to the hourly data uploads from my devices. I am looking auto using Dark Sky which offers micro-forecasting so I can put a fair bit of (real or imagined?) precision into the data.
Can the lat and long be added to one of the other values (such as temp) as “context” so I can use the Ubidots map widget?
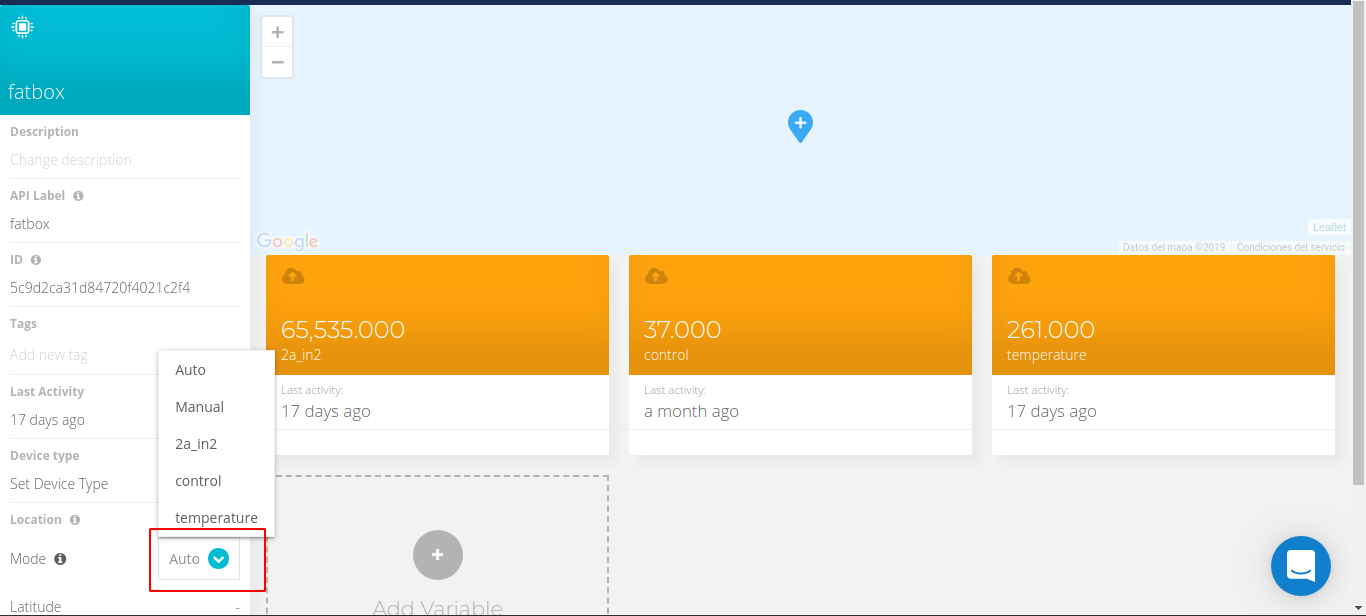
Yes, if you send your coordinates to another variable different to position, you must set the variable to retrieve coordinates values from at the device view:
OK, so it looks like I need to do a little more work in Node Red.
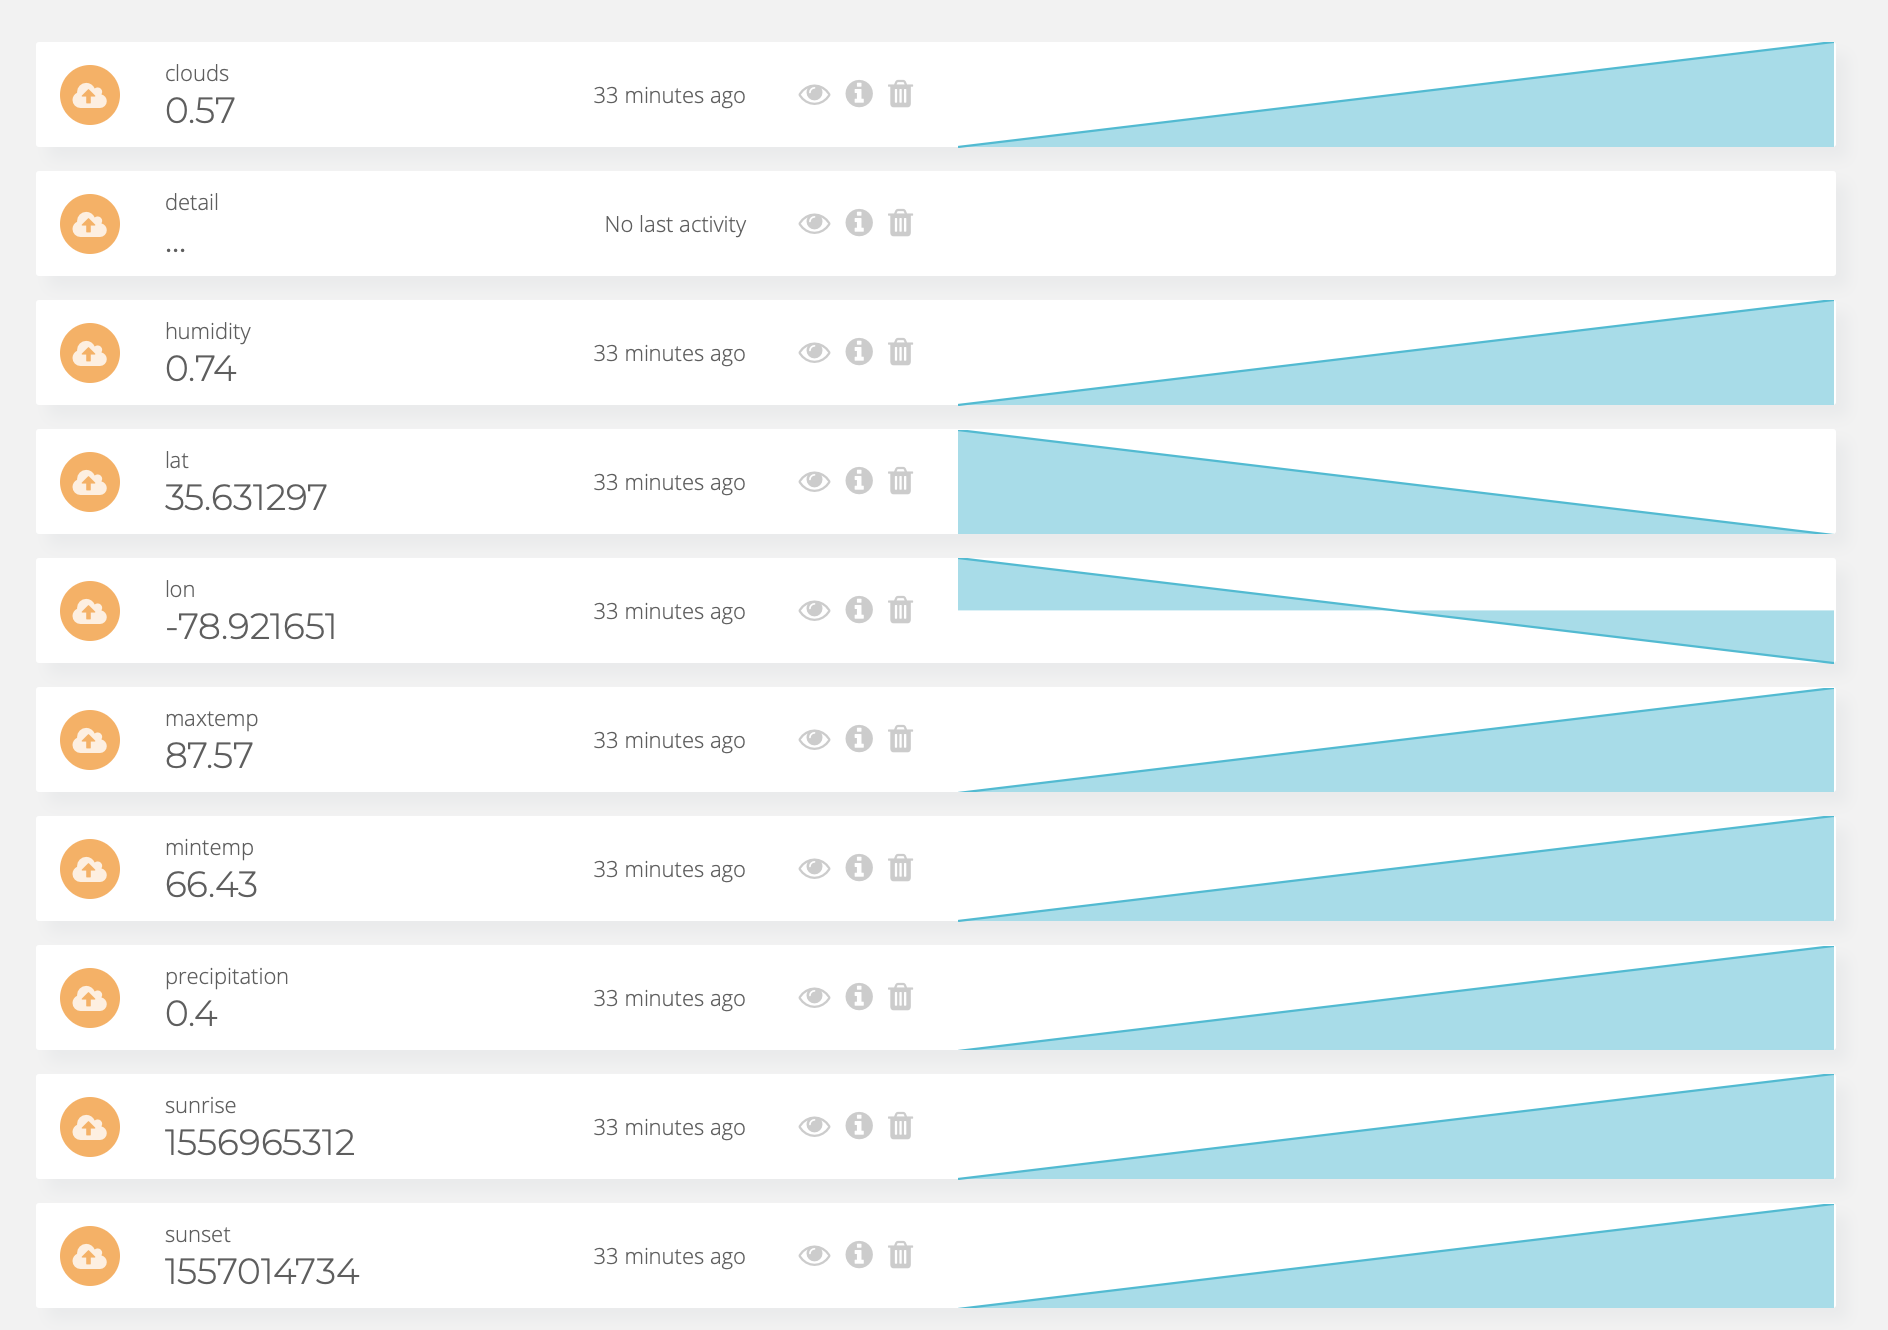
I need to take the JSON payload from Dark Sky and pare it down to just the data points I want.
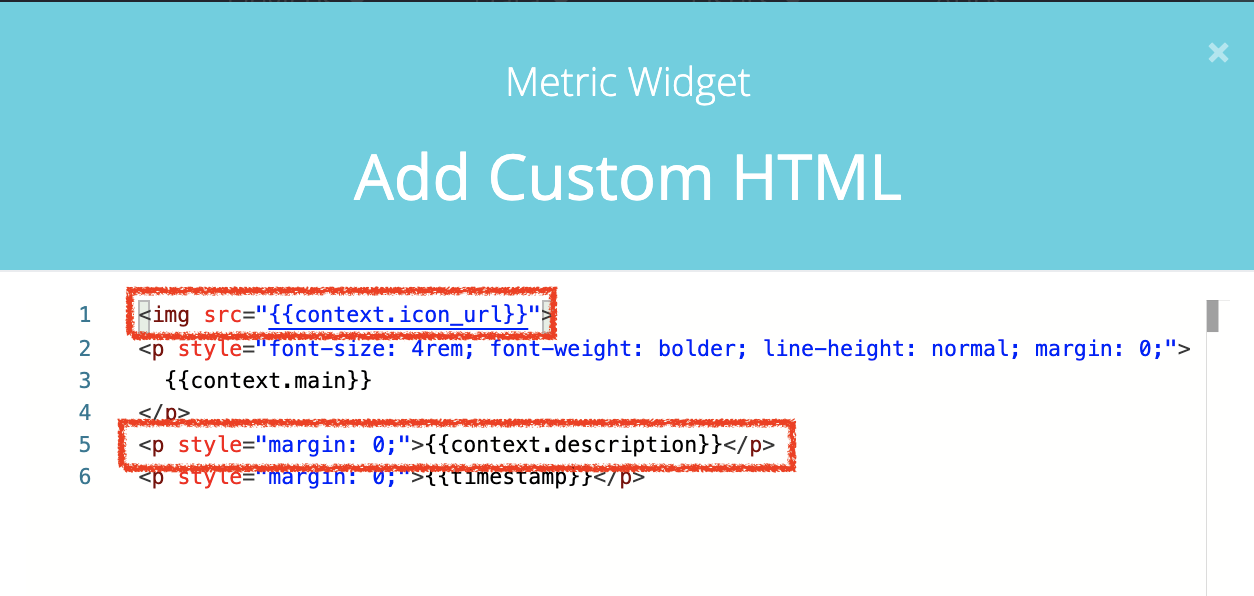
I need to pick a “key” numeric variable - such as Temp and - using Node Red and a little JavaScript - add the latitude and longitude as “context”. The map widget will then key off that variable
As I also want that detail descriptions which is text, I need to select another numeric variable - such as Humidity - and add the description as context there too.
Thank you for the link and the suggestions. I will keep you all posted on my progress.
Please know that the Ubidots NodeRed plugin-in is valued.
Hi @chipmc, thanks for your comments. Let us to know your project advance and if any assistance is required, just let me here or in the embeded chat a note and we will be glad to help you as much as we can.
UPDATE: Hi @chipmc, thanks to our new addition, Ubidots Plugins, you can now pull weather data in just a few clicks. As we alll know, DarkSky was acquired and not accepting further API usage, but see this article on how to pull data from OpenWeather:
If you have any suggestions as to which other weather API to implement, just let us know and we’ll create a new plugin.
I am now using the OpenWeather data and I love this new service. Thank you!
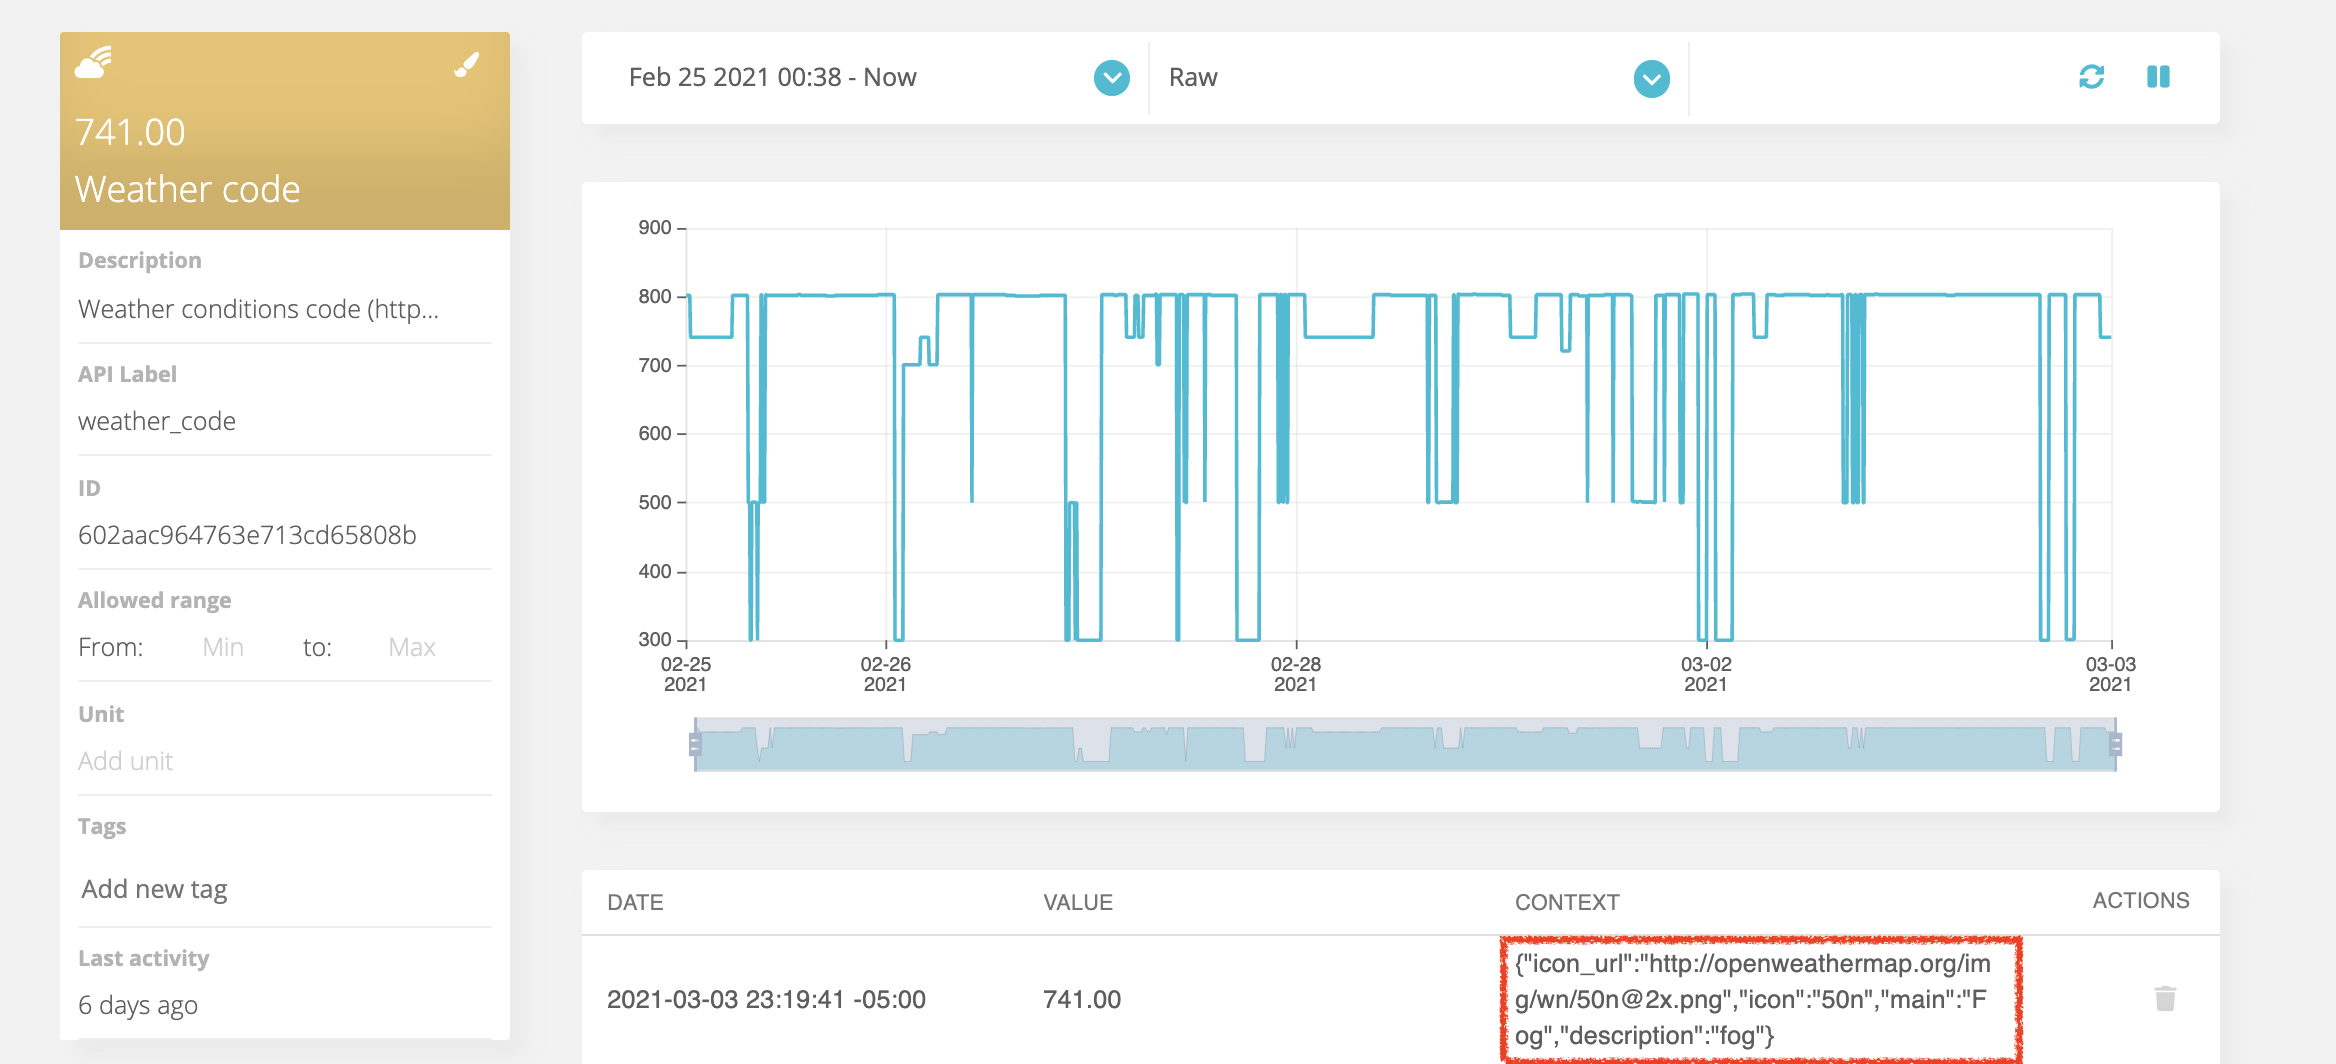
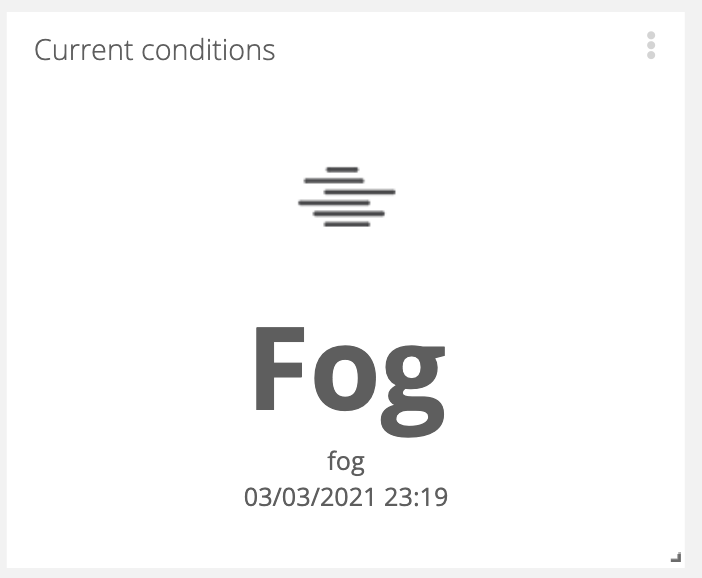
One suggestion, it would be very cool to have a custom widget for the dashboard that would take the “weather code” and convert it to an icon as described here.
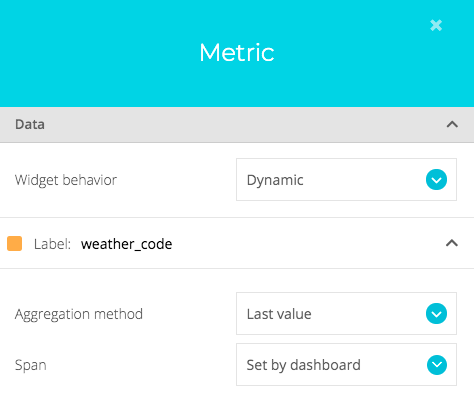
Wow! This is fantastic. Followed your instructions and it worked like a charm! Would be nice if the time of the reading matched the time specified on the dynamic dashboard. Had to use “static” variables to make this work. Love it!
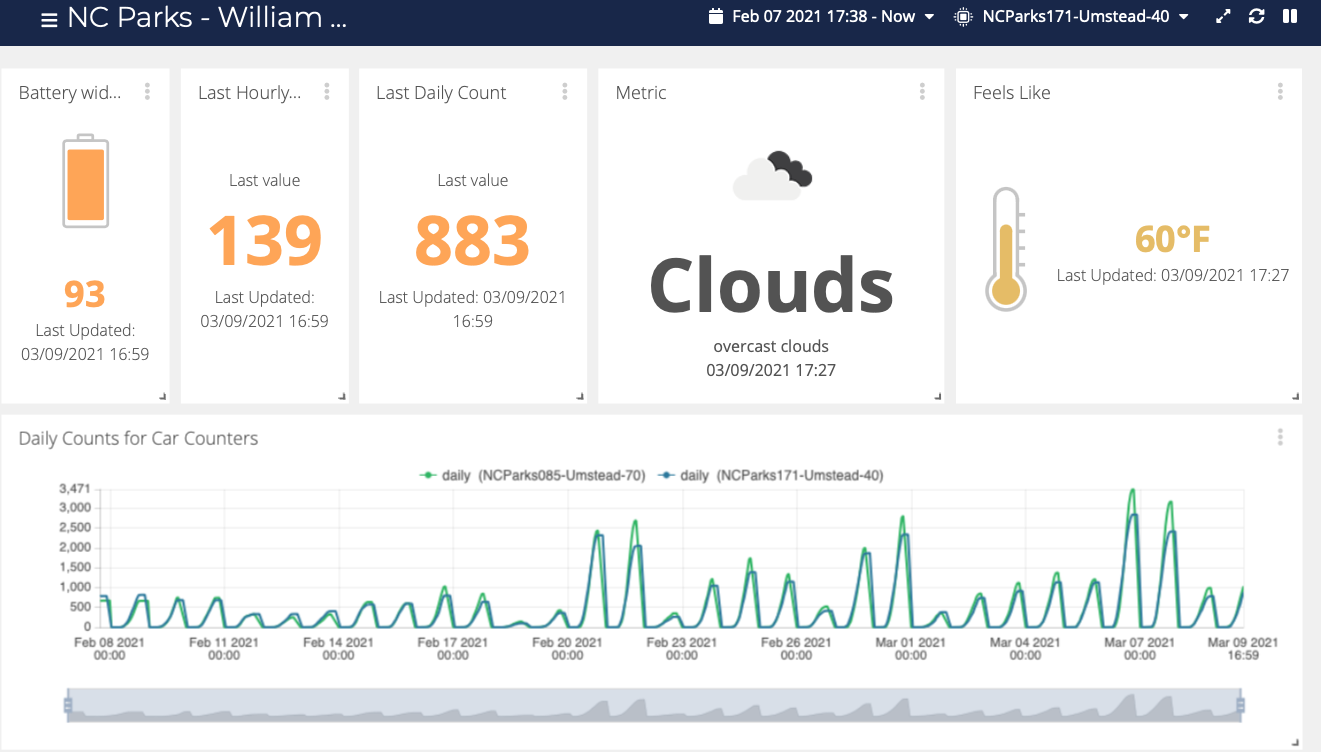
The metric widget should work just like any other dynamic widget, that it, by inheriting the device selected in the dashboard and use the variable label found in the device. See an animation here where the icon changes depending on the selected device:
OK, because, in my opinion, we don’t need a dashboard purely focused on weather - we have many commercial sites that fill this need. What would be very valuable is being able to pull in weather data to provide context for the data coming from a device. Something like, “oh, I see why there were so few pedestrians that day, it was snowing”.