I have a line chart on a dashboard and I would like to change the color of the data line that is plotted. However I don’t see an option in the line chart settings for this. I went back to my device page with the list of variables, but I can’t seem to find the option to change the default color of these variables.
Hello, poven.
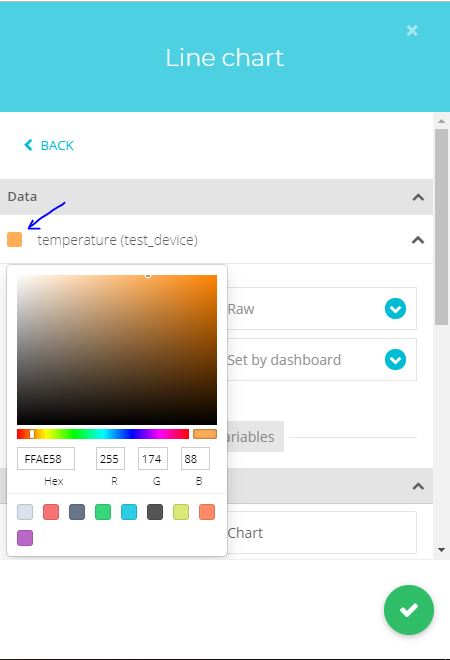
You can select the color of each variable when you’re creating the line chart widget, by clicking the square before the name of the variable:
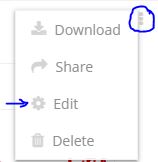
Also, you can change the colors by editing your line chart. Click the three dots in the top right of your widget and select “Edit”.
Regards,
Daniela
thanks, this works great. I guess the setting of the default color for a variable is not implemented? All of my raw variables are orange.
Hello, poven.
At the moment, there is not a feature implemented to allow changing the default color of the variables.
However, an alternative way to achieve this, is by using the feature “device types”, in which you can have a group of devices with the same characteristics, including appearance. Please refer to the following article to learn more about this feature.
All the best