Hi,
Im looking for a way to identify an event on a line graph and edit it with a label. For example, there is a major spike in pH, I add a manual entry to say we added acid. This means if someone else hovers over the spike they can see what happened.
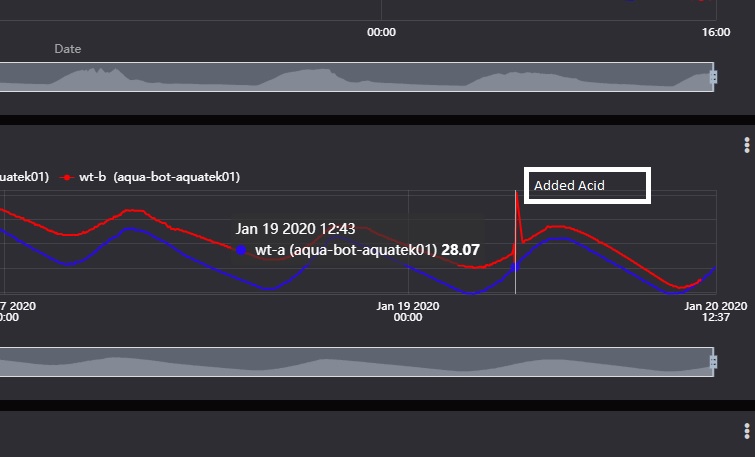
Hi there, thanks for writing. Actually, a feature as such is not implemented at our line chart widget, but I will add your suggestion as a feature request for future releases.
Meanwhile, if this is mandatory for your development and you know about JS and Html, you may use the html canvas widget to reach your goal, you may store the label in the variable’s context to be read later by your widget.
All the best.
Good Day,
Thank you for the hint to use HTML Canvas with variable context, it will help for now. Currently only know python and a bit of HTML.
Was looking at the online example for creating a Graph with Highcharts and would like to find out if you could maybe just assist with how to get the context value to also show on the graph together with the value of that dot? I pasted the online example below.
Basically I just need a hint on how to have the graph show and when the mouse points over a dot, the text should display : datetime, value and context . The below example only shows datetime and value.
Thank you.
var TOKEN = ‘token’;
var VARIABLE = ‘variable’;
function getDataFromVariable(variable, token, callback) {
var url = ‘https://industrial.api.ubidots.com/api/v1.6/variables/’ + variable + ‘/values’;
var headers = {
‘X-Auth-Token’: token,
‘Content-Type’: ‘application/json’
};
$.ajax({
url: url,
method: ‘GET’,
headers: headers,
success: function (res) {
callback(res.results);
}
});
}
var chart = Highcharts.chart(‘container’, {
chart: {
type: ‘line’
},
title: {
text: ‘Bring data from Ubidots’
},
xAxis: {
type: ‘datetime’,
},
credits: {
enabled: false
},
series: [{
data: []
}]
});
getDataFromVariable(VARIABLE, TOKEN, function (values) {
var data = values.map(function (value) {
return [value.timestamp, value.value];
});
chart.series[0].setData(data);
});