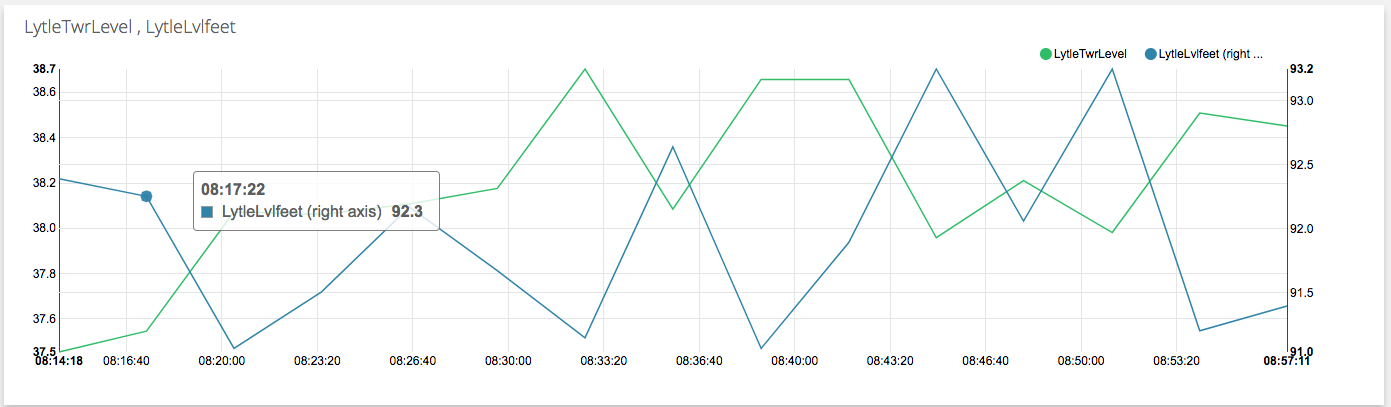
This is a double axis graph. The data on the left and right is the same, but the right axis is left data * 2.41 and it graphs inverted???
https://app.ubidots.com/ubi/getchart/page/iIGOkQoHUQ-tAWU5Y6FTfsNXXWM
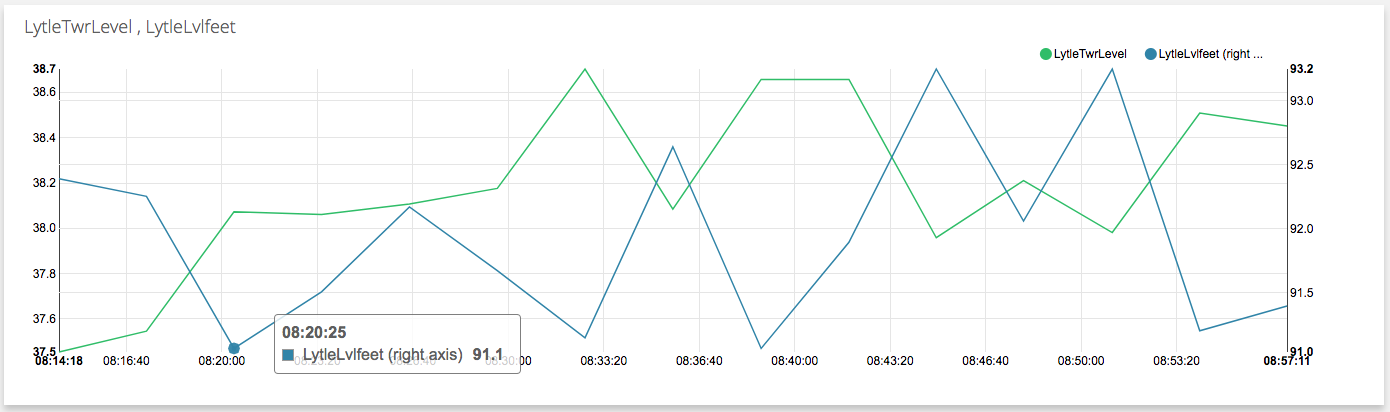
This is a double axis graph. The data on the left and right is the same, but the right axis is left data * 2.41 and it graphs inverted???
https://app.ubidots.com/ubi/getchart/page/iIGOkQoHUQ-tAWU5Y6FTfsNXXWM
Hey, how are you?
As far I see, there’s no error in how the data is being visualized in the chart. Remember these axis are independent one from another; so it’s normal that some 38 in one axis is above the 92 value of the other axis, because what matters here for positioning is the relation of the values on the same axis.
If you want a graph in which the scale is not independent for each axis you should consider using the Line Chart.
Regards!