If I have two devices showing temperature values on a line chart (for example, IoT device temp and ambient temp), is there a way to explore the data of both at the same time? It is really handy to see the relationship between the two temp values but it only shows on the widget for the past 24 hours or so. I would like to be able to select a date range for viewing the relationship between the two temp readings.
Hi @cwilli62,
I believe you can achieve this very easily within a Static dashboard (see below article).
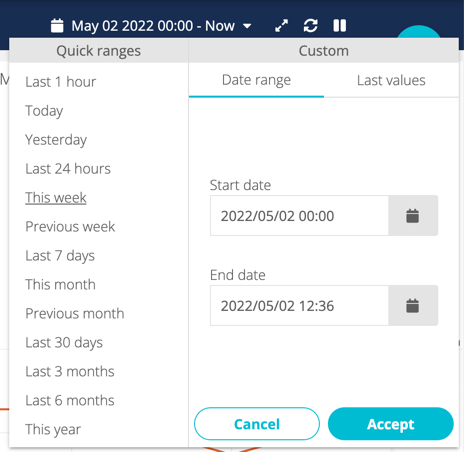
In a Line chart, simply add the 2 temp variables (IoT device and ambient) so they’re plot parallel to each other. Make sure that the “Span” field of the widget for each variable is configured to “Set by dashboard”, which will give you the ability to use the dashboard date range selector, have the widget respond to that selection and populate with the data.
Have a good one!
–D
Dsr,
Thanks for the reply. Yes, that did work. The widget diaplayed the data after selecting the proper date range. I just hadn’t thought about editing the actual widget to show the data vs. using the “explore data” function. But the editing of the widget to the correct range worked like a charm.
Cheers!
1 Like