How can I control what gets plotted “in front of” other data in a Chart widget? I had expected it had something to do with the order of the variables as selected, but when I test that theory it doesn’t work. It seems the Chart widget has some (random?) algorithm for doing this. When plotting 2 or more variables it is sometimes important which values are plotted “on top”, ie visible above other chart data.
The variables are plotted with the same order assigned during the widget’s creation. I just performed a test to verify how the variables are plotted on my side, and everything is working as should be. Could you check again if the variables are being plotted with a random order?
Is it the order assigned during the original creation or after editing? I try to change it (by deleting and re-adding a variable) and it doesn’t seem to do anything.
What I am seeing is that nothing I do will change the order, short of deleting the Chart and re-creating it, which is a PITN…
It would be really nice if one could just drag the icons for the variables around and change the order…
Will
The order will be assigned both when creating the widget and when modifying it.
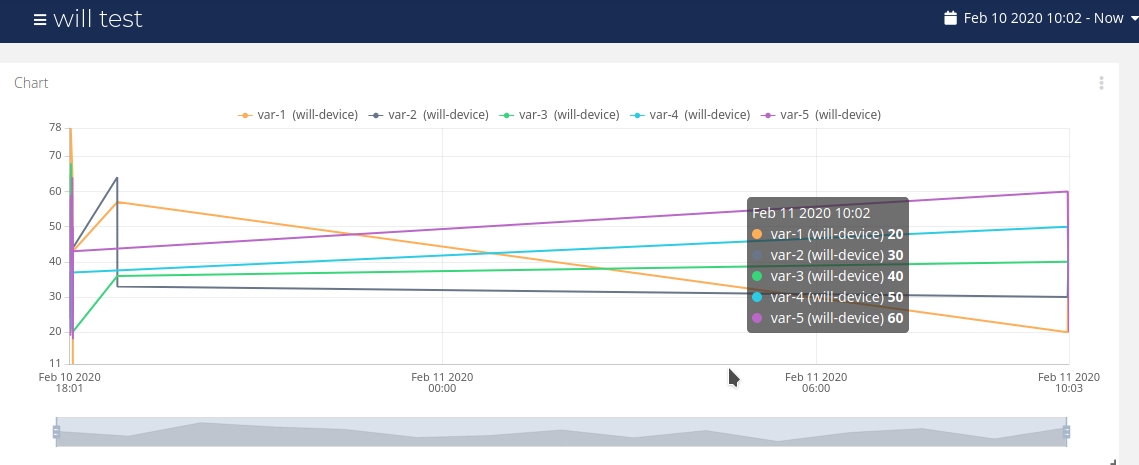
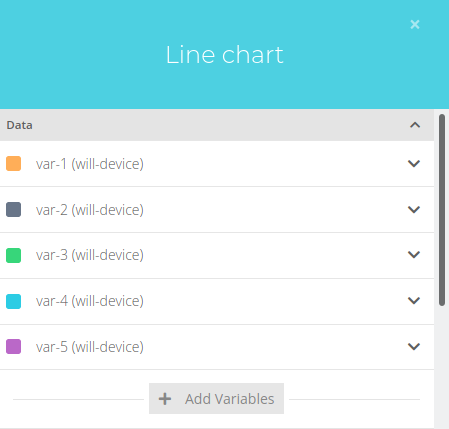
Below you can see how the lines are being plotted in the same order as assigned in the widget settings. In my case “var-1” would be the first variable to be plotted, and “var-5” the last one.
That’s not what I’m seeing. I’m plotting 2 variables, for example Reboots and Door State. Regardless of the order I put them in, Door State is always plotted on top. I wanted it to be below Reboots and I cannot achieve this. In this screen cap you can see that “Door State” is first, and “Reboot” is second, but they are drawn in the opposite order. Changing the order the variables are selected does not change the order in which they are plotted.
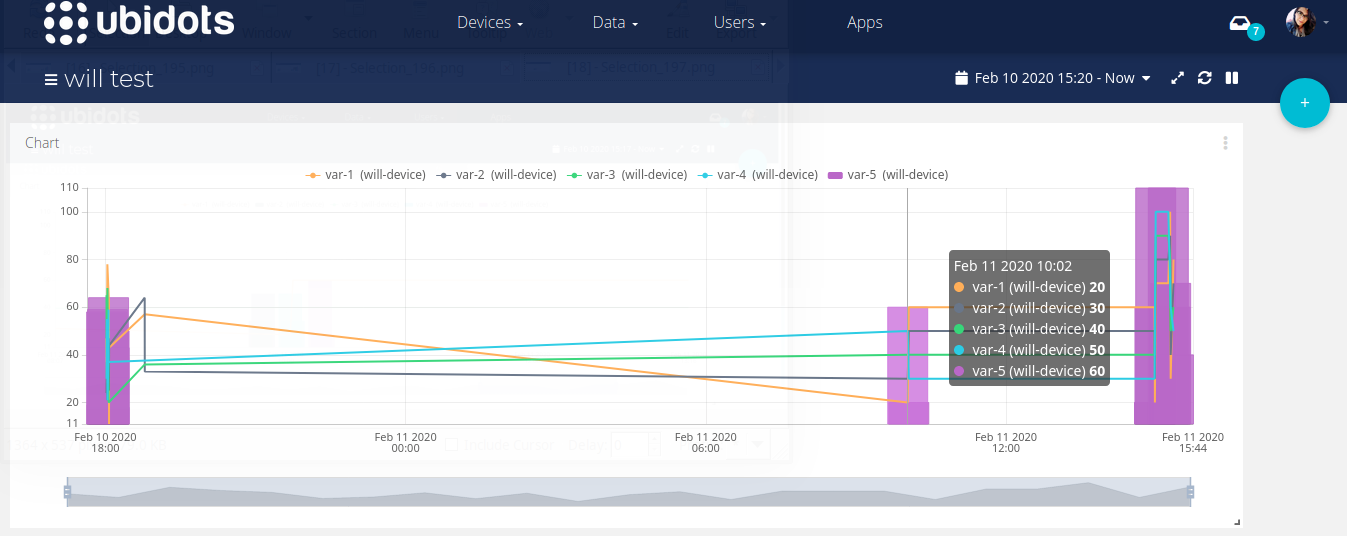
I found out the problem. The assigned variables have a different “type”, one is configured to plot lines and another one to plot bars. The library in charge of the line chart prioritizes the lines because the bars would not allow you to see the endpoints of the other variables.
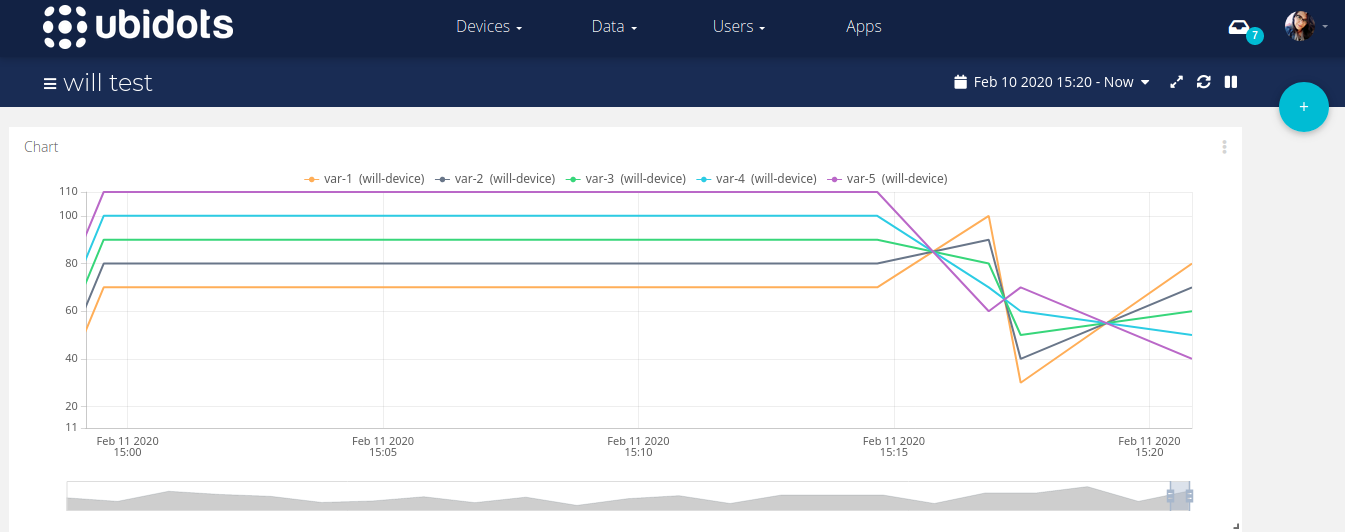
As you can see in the following graph, all the lines are plotted in the correct order.
ah, I see. How would I know this? and what if I want the bars to plot in front of the lines? (which in this case I do). I could change so both are “bars” but that’s not really what I want… but for now that’s what I will do.