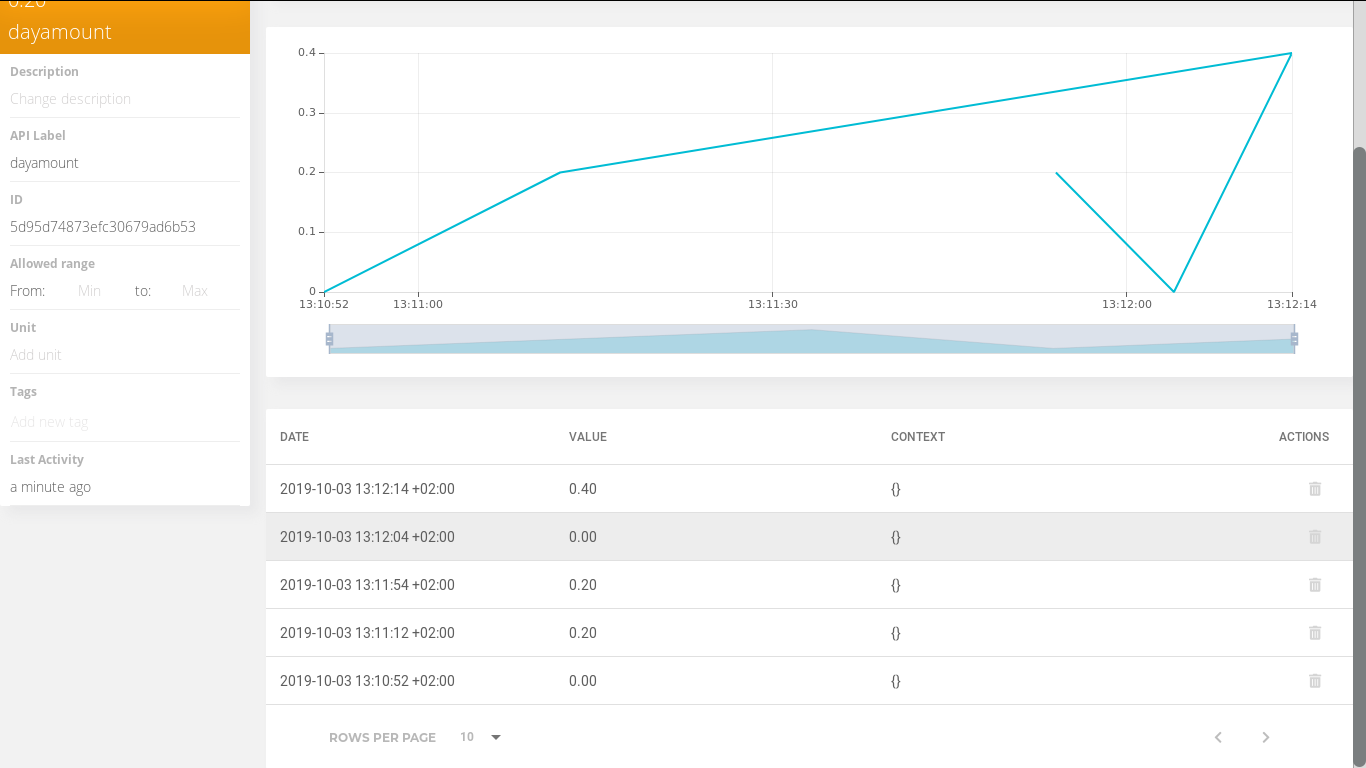
Can anyone explain this?
picture
(I had to link the picture in from external as the upload did not work for some reason)
Why is the line going forth and back? it should be going across horizontally, then down to 0 and then up again?
This is the code I am using to upload the datapoints:
  dtostrf(amountyesterday, 4, 1, str_amounttoday);
  dtostrf(currenttime-10, -32, 0, str_currenttime);
  sprintf(payload, "{\"%s\": {\"value\": %s , \"timestamp\":  %s000 }}", VARIABLE_AMOUNT, str_amounttoday, str_currenttime); // Adds a zero to make graph look good
  if (debug) Serial.println(payload);
  mqttclient.publish(topic, payload);
  delay(500);
  dtostrf(currenttime, -32, 0, str_currenttime);
  sprintf(payload, "{\"%s\": {\"value\": 0.0, \"timestamp\":  %s000 }}", VARIABLE_AMOUNT, str_currenttime); // Adds the value
  if (debug) Serial.println(payload);
  mqttclient.publish(topic, payload);
  delay(500);
  dtostrf(currenttime+10, -32, 0, str_currenttime);
  dtostrf(amounttoday, 4, 1, str_amounttoday);
  sprintf(payload, "{\"%s\": {\"value\": %s , \"timestamp\":  %s000 }}", VARIABLE_AMOUNT, str_amounttoday, str_currenttime); // Adds the value
  if (debug) Serial.println(payload);
  mqttclient.publish(topic, payload);
  delay(500);
Resulting in the following payloads:
{“dayamount”: {“value”: 0.2 , “timestamp”: 1570101114000 }}
{“dayamount”: {“value”: 0.0, “timestamp”: 1570101124000 }}
{“dayamount”: {“value”: 0.4 , “timestamp”: 1570101134000 }}
