[SOLVED] Outline overlays on map widget

Hello community,

Is there anyone here that have managed to insert overlays onto the map widget? I have zero experience with html, java or css so I have no idea where to begin.

What I need is to overlay outlines of shapes onto my map widget, this is where my irrigation equipment is moving. Some move inside polygonal areas, others are center pivots that need a circular outline along the outer edge of the pivot.

With this it would be very cool if I could have small pieces of data displayed as small text next to the gps location of my iot device, like the current pressure at the sprinkler, or ambient temperature.

If there is someone out there with experience on this, and who is willing to share some knowledge, I would be very thankful.

Thanks,
Hein

Come to think of it, this problem would be solved by having an option to keep geofences visible!

Hey Hein,

Please check the topic:

All the best,
Maria C.

Dear community,

Is there anhone on here that can share some insight on this. Or anyone that can give guidance, or even a simple example of the http, java and css that is needed to get this done.

A simple screen overlay like in the link supplied. Two elements, one is just a fixed outline of a circle that remains static, and then a line that can follow the current device position from the centre of the circle.

http://www.zamlamb.com/misc/pivot.jpg

thanks,
Hein

Ok, I managed to create an overlay by using the following code:

<!DOCTYPE html>
<html> 
<body>

<div id="map" style="width:460px;height:460px"></div>

<script>
function myMap() {
  var cp8 = new google.maps.LatLng(-16.002981,28.080995);

  var mapCanvas = document.getElementById("map");
  var mapOptions = {center: cp8, zoom: 15, mapTypeId: google.maps.MapTypeId.SATELLITE};
  var map = new google.maps.Map(mapCanvas,mapOptions);

  var myCity = new google.maps.Circle({
    center: cp8,
    radius: 470,
    strokeColor: "#0000FF",
      strokeOpacity: 1,
      strokeWeight: 2,
      fillColor: "#0000FF",
      fillOpacity: 0.2
    });
    myCity.setMap(map);
  }
  </script>

  <script src="https://maps.googleapis.com/maps/api/js?key=mykey&callback=myMap"></script>


  </body>
  </html>

Now on the next step, how do I get my device location icon on here? Can someone give me the HTML code for the stock map widget?

And is there a way to display one or two of the values of other variables on the map by default, without the need to tap on the device icon on the map?

This seems to me to be something very simple, but I cannot find ANY documentation anywhere on this from ubidots.

1 Like

Dear @agrisense,

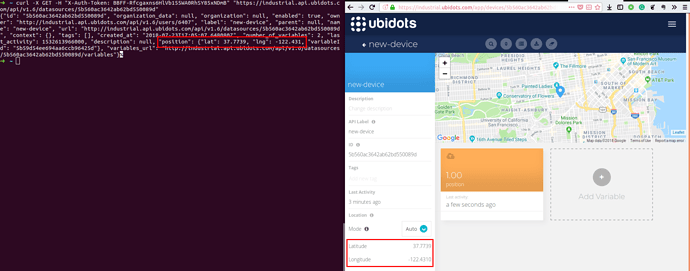
To get the device location you should handle a GET HTTP request to retrieve the information of the device. To handle the request, please refer to this endpoint in the Ubidots REST API Reference.

As you can see in the image below, the result should be:

At this point, you should parse the answer from the server in order to obtain the coordinates. Once you are able to obtain just the coordinates, save them in two variables lat and log and assign them in the following line:

  var cp8 = new google.maps.LatLng(lat, lng);

Just as a reference, below is an example of a GET HTTP request in javascript. You should modify it based on your needs:

const xhr = new XMLHttpRequest();

const TOKEN = 'BBFF-Rfcgaxns6HlVb155WA0RhSY85xNDmB';
const DEVICE_LABEL = 'my-new-device';
const VARIABLE_LABEL = 'my-sensor';
const HOST = 'https://things.ubidots.com';
const ENDPOINT = `/api/v1.6/devices/${DEVICE_LABEL}/${VARIABLE_LABEL}/lv`;

const url = `${HOST}${ENDPOINT}`;

xhr.open("GET", url, true);
xhr.setRequestHeader("Content-Type", "application/json");
xhr.setRequestHeader("x-auth-token", TOKEN);
xhr.send(null);
console.log(xhr.responseText);

I hope this would help you!

All the best,
Maria C.

Thank you Maria,

Now we’re moving in the right direction. As a person who is not a java programmer, but needs this basic functionality on my ubidots interface, would you mind giving me some more clarity on the java script side.

I removed this from the html:
var cp8 = new google.maps.LatLng(-16.002981,28.080995);

and replaced it with
var cp8 = new google.maps.LatLng(lat, lng);

Then I placed the java script you supplied into the JS tab, inserting the token, device and variable label that contains the gps position.

Like I said I know nothing about JS but shouldn’t there be a call for the newly created variables lat and lon somewhere?

Also, const ENDPOINT is not used anywhere

Greetings, I have taken your script example and the one shared by Maria and created a small script that may serve you as starter point to achieve your goal, please reference it below:

HTML:

<div id="map" style="width:460px;height:460px"></div>

JS:

const TOKEN = '';
       const DEVICE_LABEL = '';
       const VARIABLE_LABEL = ""
       const HOST = 'https://industrial.api.ubidots.com';
       const ENDPOINT = `/api/v1.6/devices/${DEVICE_LABEL}/${VARIABLE_LABEL}/values/?page_size=1`;
       const url = `${HOST}${ENDPOINT}`;
       const xhr = new XMLHttpRequest();
       var lat, lng;

       xhr.addEventListener('load', parseResponse);

       function myMap() {
           var cp8 = new google.maps.LatLng(lat, lng);

           var mapCanvas = document.getElementById("map");
           var mapOptions = {center: cp8, zoom: 15, mapTypeId: google.maps.MapTypeId.SATELLITE};
           var map = new google.maps.Map(mapCanvas,mapOptions);

           var myCity = new google.maps.Circle({
               center: cp8,
               radius: 470,
               strokeColor: "#0000FF",
               strokeOpacity: 1,
               strokeWeight: 2,
               fillColor: "#0000FF",
               fillOpacity: 0.2
               });
               myCity.setMap(map);
       }
       
       function getDeviceLocation(myMap) {
           xhr.open("GET", url, true);
           xhr.setRequestHeader("Content-Type", "application/json");
           xhr.setRequestHeader("x-auth-token", TOKEN);
           xhr.send(null);        
       }

       function parseResponse(ev) {
           var str_response = ev.target.response;
           console.log(JSON.parse(str_response).results[0].context.lat);
           lat = (JSON.parse(str_response).results[0].context.lat);
           lng = (JSON.parse(str_response).results[0].context.lng);
           myMap();
       }

       document.onload = getDeviceLocation();
       // updates every 10 minutes
       setInterval(getDeviceLocation, 60000 * 10);

Third Party Libraries:

https://maps.googleapis.com/maps/api/js

I hope this helps you to start with your custom development.

Please keep in mind that the HTML Canvas is intended for users with JS experience as a means to make an application more appealing or functional. If you are not familiar with JS, in my experience, I would begin with the basics of functions, callbacks, and API management before of digging deeper into the HTML widget.

Conversely, if you instead prefer to avoid the headache, Ubidots Customer Development Services are available to build a widget to your specifications at a contracted rate. You can contact sales@ubidots.com with the specs and use-case of your intended widget an Ubidots Application Engineer will work with you to determine the requirements the estimated development cost of your request.

Have a nice rest of day.

Thank you @jotathebest

It works! Two questions:

  1. how do I get the icon of the position back? It seems to have dissapeared with the new code
  2. Where do I enter my google maps API key? The map background now has a watermark that says “for development purposes only.” I suspect this has to do with my API key not being used?

got it: at ‘include JS library’ I needed this:
https://maps.googleapis.com/maps/api/js?key=my key&callback=myMap

Now its just my variable icons that’s missing, and full screen option, heat map and time range that is gone…

Greetings, those features are related only with the original widget map, as you are using a blank HTML Canvas those features will not be present.

All the best.

So it’s either using the default map widget with zero added functionality, or a widget with custom functionality but excludes all default functionality? Not even the display of the variable icon???

Jeepers. The limitations on your map functionality is really a big concern for our continued use of Ubidots. We are starting to grow our business but I’m still not convinced we can work with the extreme limits on your map functionality.

The solution is to pay your company every time we need some basic functionality?

@agrisense,

As always thank you for reaching out to Ubidots. You seem to be having trouble and for that I apologize as we always want to ensure a premium user experiences, no matter the task. I can understand that you want the default features of the map widget in the HTML Canvas, but as you can deduce yourself, this does not make sense for the other 46,000 Ubidots users. For example, if you wanted to display a custom 2 line-chart with Max and Min lines using the HTML Canvas, you surely would not want to see a heatmap activation tool in the settings bar would you? As this does not make sense for you, it does not make sense for us either. And for this reason, all HTML Canvas widgets must be coded in their entirety by you, or if you do not wish to do so yourself, under a custom development request to Ubidots DevOps team.

With regards to the Maps - you can either request that Ubidots develop additional features or usability for our default widgets (as you have done in the past, we added satellite view and are developing additional geo-fence capabilities after your good suggestions in this Q3). Or, if you do not want to pay Ubidots and we cannot move at the pace you demand – simply do it yourself. If this does not meet the usability that you have come to expect from Ubidots and our support, it would be advisable for you to seek a service that fits your expectations elsewhere.

Lastly, we will continue to work to improve as we always do, but we ask that you refrain from any argumentative statements in this open forum. We are here to help you design and deploy IoT Applications and we will continue to be here. If you feel that your needs are not being met - please let us know directly at support@ubidots.com and a member from Ubidots team can step up to identify the solution and see your application continue to grow and succeed.

Thank you for choosing to develop with Ubidots, and have a great rest of your day

Not trying to argue. Simply trying to get most out of your product.

But we have frustration around the fact that there is a lack of what some may call basic functionality in your product, it works very well and we can read data from our iot devices, but mapping is probably one of the most important aspects of remote monitoring and here you really offer basically no functionality, except show where the device is. Even when you click on the icon it displays the whole list of all the variable values, most of which normally should remain hidden from view. When I click on the location icon of an agricultural device I really do not want to see all twelve variable values, maybe one or two important ones. And it would be great if they appeared by default. But you have nothing in place to customise any of this. This in my view is probably the most basic thing to think of when you sell a platform to the public as you have, but the customisability is just not there. (By the way, I’ve never been able to get time range and heat map to work on IOS)

Unless you’re an expert in java and html of course, but how many hardware engineers are out there that are as proficient with programming java as they are with designing devices and programming them in C+? I have now figured out how to get my overlays onto my maps (thank you very much for the code you sent) but I still have to figure out how to show selected variables on the map at all times, and running a business as we do there simply is no scope to start learning Java just to add functionality to a product which probably should have the functions built in, but doesn’t.

Anyway, we’ll plod along and figure it out as we go. I just wish there was an active community here that would be willing to share knowledge.

thank you for always getting back to our queries in a timely fashion, you guys have been very helpful and we do appreciate it.

@Agrisense

Thank you for keeping us on our toes. We are here to help and will continue to work with you to see your application succeed as quickly as possible.

If you have any additional request, please let us know or reach our support team directly at support@ubidots.com and we’ll do our best to put you on the right path, as we always do.

All the best.

Hello Jose,

I have come up with the code below, by following your example and adding a second value to display on the map. I have limited success with this code, would you be so kind as to have a look and see what I’m missing?

I’m able to extract the pressure value in the same way you got the lat & lon, but I can either display the pressure (and lose the lat lon) or display the correct position (and lose the correct pressure.)

Are you able to spot my mistake?

I’ll be sending an email to you and Cameron shortly.

Thanks,
Hein

   const TOKEN = 'my token';
   const DEVICE_LABEL = 'device label';
   const VARIABLE_LABEL_POS = 'cell-signal';
   const VARIABLE_LABEL_PRESS = 'pressure';
   
   const HOST = 'https://industrial.api.ubidots.com';
   const ENDPOINT_POS = `/api/v1.6/devices/${DEVICE_LABEL}/${VARIABLE_LABEL_POS}/values/?page_size=1`;
   const ENDPOINT_PRESS = `/api/v1.6/devices/${DEVICE_LABEL}/${VARIABLE_LABEL_PRESS}/values/?page_size=1`;
   const urlpos = `${HOST}${ENDPOINT_POS}`;
   const urlpress = `${HOST}${ENDPOINT_PRESS}`;
   
   const xhr = new XMLHttpRequest();
   var lat, lng;
   var pressureVal;

   xhr.addEventListener('load', parseResponse);
 //      xhr.addEventListener('load', parsePressureResponse);

   function myMap() {
       var gps = new google.maps.LatLng(lat, lng);
       var pivotcentre = new google.maps.LatLng(-15.838519, 28.273993);
       var mapCanvas = document.getElementById("map");
       var mapOptions = {disableDefaultUI: true, center: pivotcentre, zoom: 16, mapTypeId: google.maps.MapTypeId.SATELLITE};
       var map = new google.maps.Map(mapCanvas,mapOptions);
       
     var pivotLine = new google.maps.Polyline({
           path: [gps, pivotcentre],
           strokeColor: "#fafd00",
           strokeOpacity: 1,
           strokeWeight: 5
           });
           pivotLine.setMap(map);
     
     
     var pivot = new google.maps.Circle({
           center: pivotcentre,
           radius: 300,
           strokeColor: "#0000FF",
           strokeOpacity: 1,
           strokeWeight: 5,
           fillColor: "#0000FF",
           fillOpacity: 0.2
           });
           pivot.setMap(map);
                   
          var pressureLabel = "Pressure: ";          
          var infowindow = new google.maps.InfoWindow({
          content: pressureLabel + pressureVal + " bar",
          position: gps
          });
          infowindow.setMap(map);
          
   }    // myMap
   
   function getDeviceLocation(myMap) {
       xhr.open("GET", urlpos, true);
       xhr.setRequestHeader("Content-Type", "application/json");
       xhr.setRequestHeader("x-auth-token", TOKEN);
       xhr.send(null);        
   }

   function parseResponse(ev) {
       var str_response = ev.target.response;
       console.log(JSON.parse(str_response).results[0].context.lat);
       lat = (JSON.parse(str_response).results[0].context.lat);
       lng = (JSON.parse(str_response).results[0].context.lng);
       myMap();
   }

   function getPressure(myMap) {
       xhr.open("GET", urlpress, true);
       xhr.setRequestHeader("Content-Type", "application/json");
       xhr.setRequestHeader("x-auth-token", TOKEN);
       xhr.send(null);        
   }

   function parsePressureResponse(ev) {
       var str_response2 = ev.target.response;
       console.log(JSON.parse(str_response2).results[0].value);
       pressureVal = (JSON.parse(str_response2).results[0].value);
       myMap();
   }

   document.onload = getDeviceLocation();
   setInterval(getDeviceLocation, 60000 * 10);
   
 //      document.onload = getPressure();
 //      setInterval(getPressure, 60000 * 10);
Hi there, below you can find an example reference modifying your actual code a little bit:

const TOKEN = '';
const DEVICE_LABEL = 'truck';
const VARIABLE_LABEL_POS = 'position';
const VARIABLE_LABEL_PRESS = 'pressure';

const HOST = 'https://industrial.api.ubidots.com';
const ENDPOINT_POS = `/api/v1.6/devices/${DEVICE_LABEL}/${VARIABLE_LABEL_POS}/values/?page_size=1`;
const ENDPOINT_PRESS = `/api/v1.6/devices/${DEVICE_LABEL}/${VARIABLE_LABEL_PRESS}/lv`;
const urlpos = `${HOST}${ENDPOINT_POS}`;
const urlpress = `${HOST}${ENDPOINT_PRESS}`;

const xhr = new XMLHttpRequest();
const xhr2 = new XMLHttpRequest();
var lat, lng;
var pressureVal;

xhr.addEventListener('load', parseResponse);
xhr2.addEventListener('load', parsePressureResponse);

function myMap() {
   var gps = new google.maps.LatLng(lat, lng);
   var pivotcentre = new google.maps.LatLng(-15.838519, 28.273993);
   var mapCanvas = document.getElementById("map");
   var mapOptions = {disableDefaultUI: true, center: pivotcentre, zoom: 16, mapTypeId: google.maps.MapTypeId.SATELLITE};
   var map = new google.maps.Map(mapCanvas,mapOptions);
   
   var pivotLine = new google.maps.Polyline({
         path: [gps, pivotcentre],
         strokeColor: "#fafd00",
         strokeOpacity: 1,
         strokeWeight: 5
         });
         pivotLine.setMap(map);
   
   
   var pivot = new google.maps.Circle({
         center: pivotcentre,
         radius: 300,
         strokeColor: "#0000FF",
         strokeOpacity: 1,
         strokeWeight: 5,
         fillColor: "#0000FF",
         fillOpacity: 0.2
         });
         pivot.setMap(map);
                 
        var pressureLabel = "Pressure: ";          
        var infowindow = new google.maps.InfoWindow({
        content: pressureLabel + pressureVal + " bar",
        position: gps
        });
        infowindow.setMap(map);
      
}    // myMap

function getDeviceLocation(myMap) {
   xhr.open("GET", urlpos, true);
   xhr.setRequestHeader("Content-Type", "application/json");
   xhr.setRequestHeader("x-auth-token", TOKEN);
   xhr.send(null);        
}

function parseResponse(ev) {
   var str_response = ev.target.response;
   console.log(JSON.parse(str_response).results[0].context.lat);
   lat = (JSON.parse(str_response).results[0].context.lat);
   lng = (JSON.parse(str_response).results[0].context.lng);
   myMap();
}

function getPressure(myMap) {
   xhr2.open("GET", urlpress, true);
   xhr2.setRequestHeader("Content-Type", "application/json");
   xhr2.setRequestHeader("x-auth-token", TOKEN);
   xhr2.send(null);        
}

function parsePressureResponse(ev) {
  pressureVal = ev.target.response;
  console.log(pressureVal);
}

function addLoadEvent(func) {
  var oldonload = window.onload;
  if (typeof window.onload != 'function') {
    window.onload = func;
  } else {
    window.onload = function() {
      if (oldonload) {
        oldonload();
      }
      func();
    }
  }
}

addLoadEvent(getDeviceLocation());
addLoadEvent(getPressure());

// Updates every 10 minutes
setInterval(getDeviceLocation, 60000 * 10);
setInterval(getPressure, 60000 * 10);

Hope it helps you.

All the best

Absolutely, thanks Jose! Works like a charm.

Just one thing - pressure seems to be undefined until the first time that the map refreshes. How can we make sure the pressure is defined just before the map loads for the first time?