Hi all
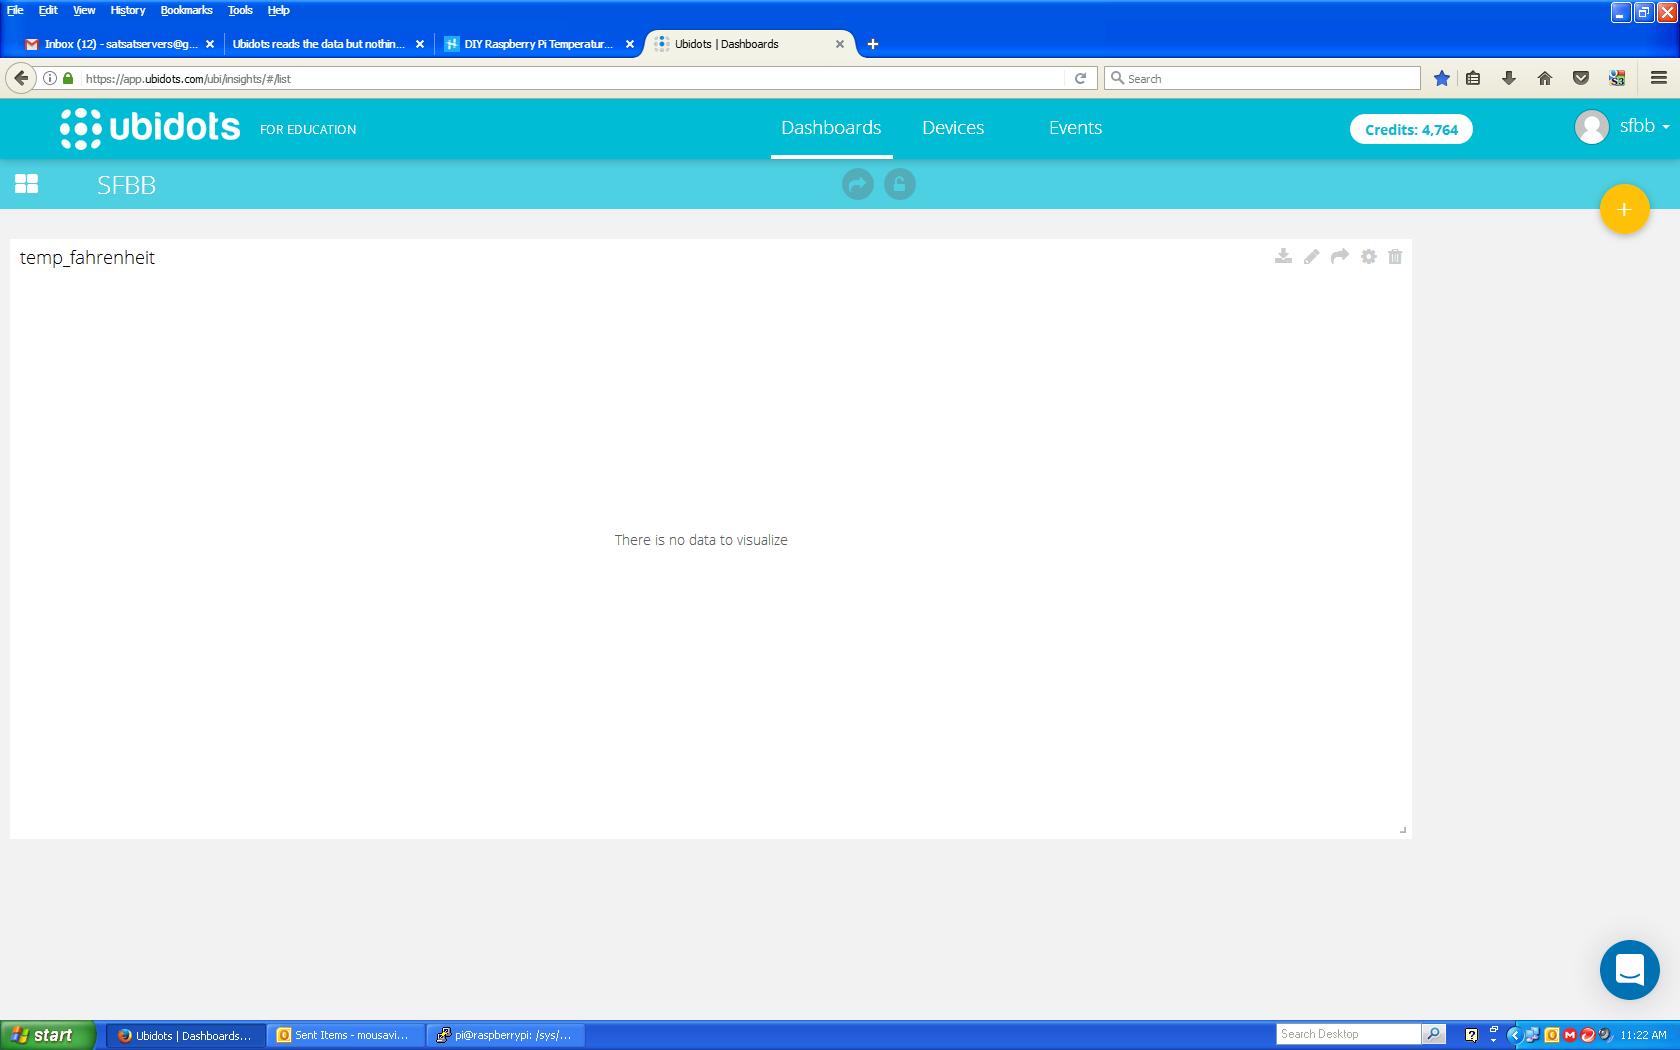
I have a raspberry pi hooked to a temperature sensor, i see data is coming to ubidots and time stamps are also okay, but when i add a line graph to my dashboard, nothing shown in graph!
it was working last week perfectly but not now
Dear @sfbb,
Can you provide us more information about your inconvenience? For example, a video recording of your account while it’s receiving data and showing the chart widget to check the behavior presented by your side, also a screenshot can be really helpful for us to check it!
All the best,
Maria c.
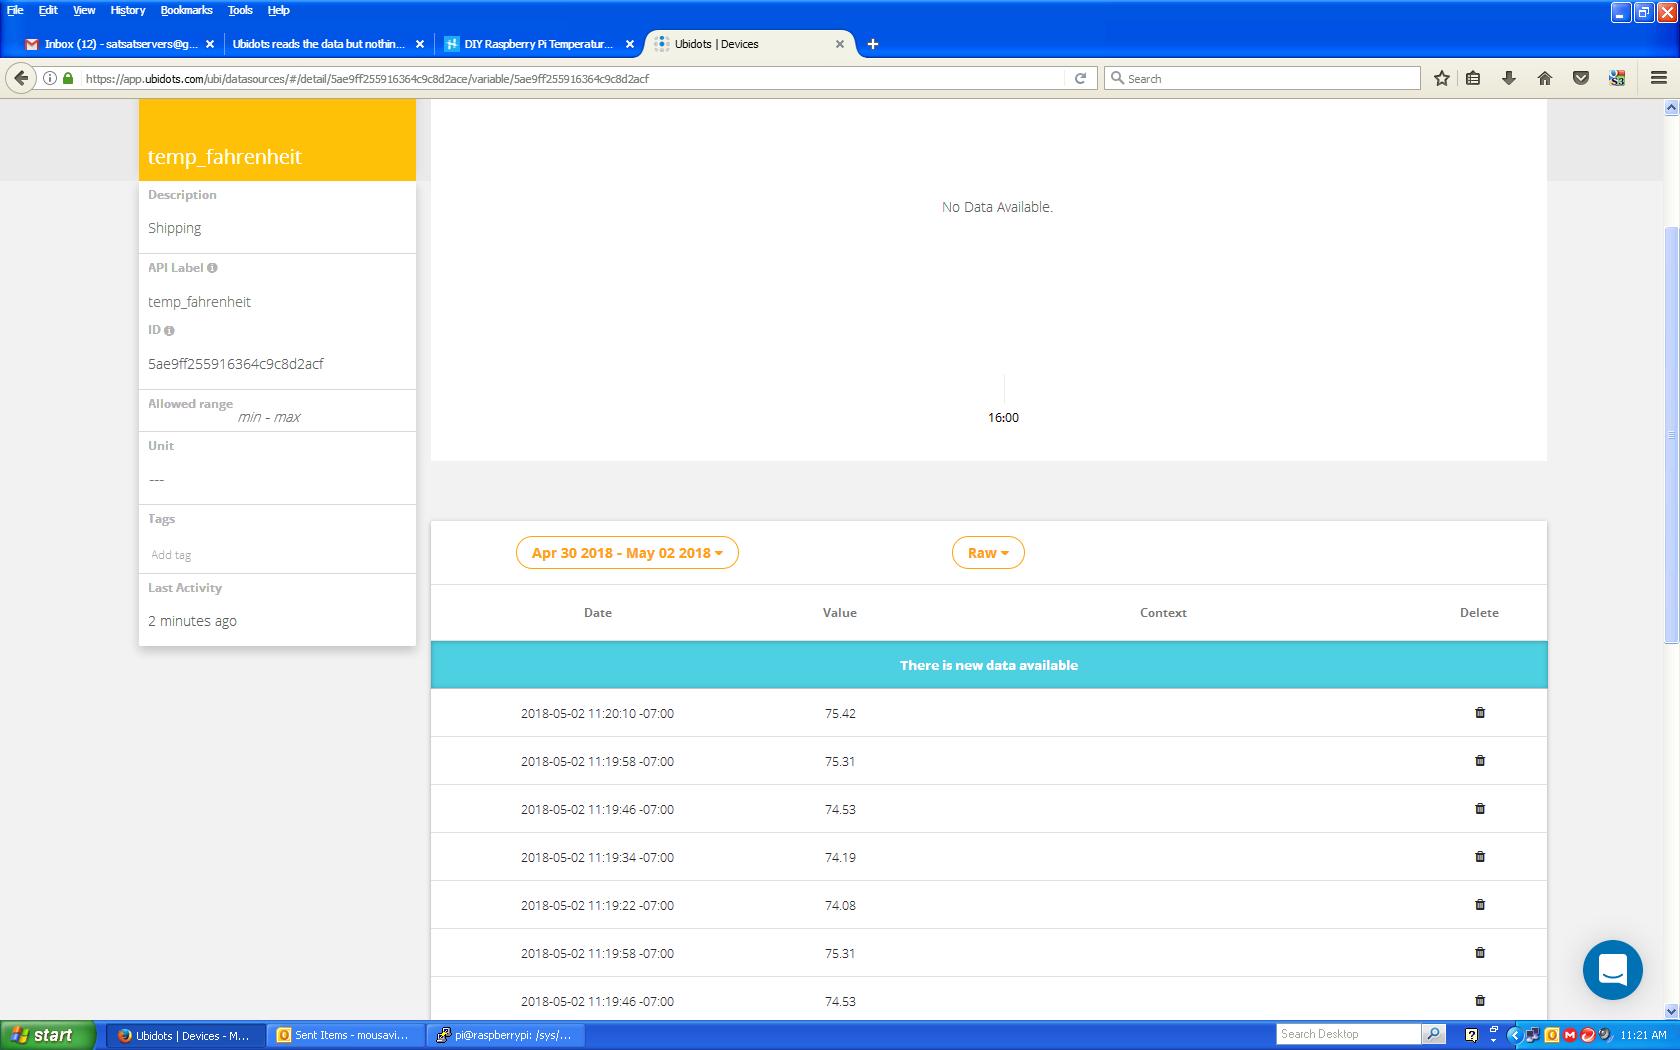

One thing that i see, now is 11:28 AM here but the time on the X-Axis on variable page is shown 16:00 !
I already set the time zone on my raspberry pi and on my ubidots account right(Pacific time)
Dear @sfbb,
By the moment, the platform is under deployments, so for the next hours you will be presenting some inconsistency in the visualization of the data but the values will be keep storage in our DB.
We are apologize about the inconvenience presented, we will let you know when everything is stable again.
All the best,
Maria C.
Oh okay great
thanks