My STEM account seems to be having problems with my datapoint. It does shows the last value received but I am not able to retrieve any data nor show graphs. Just getting
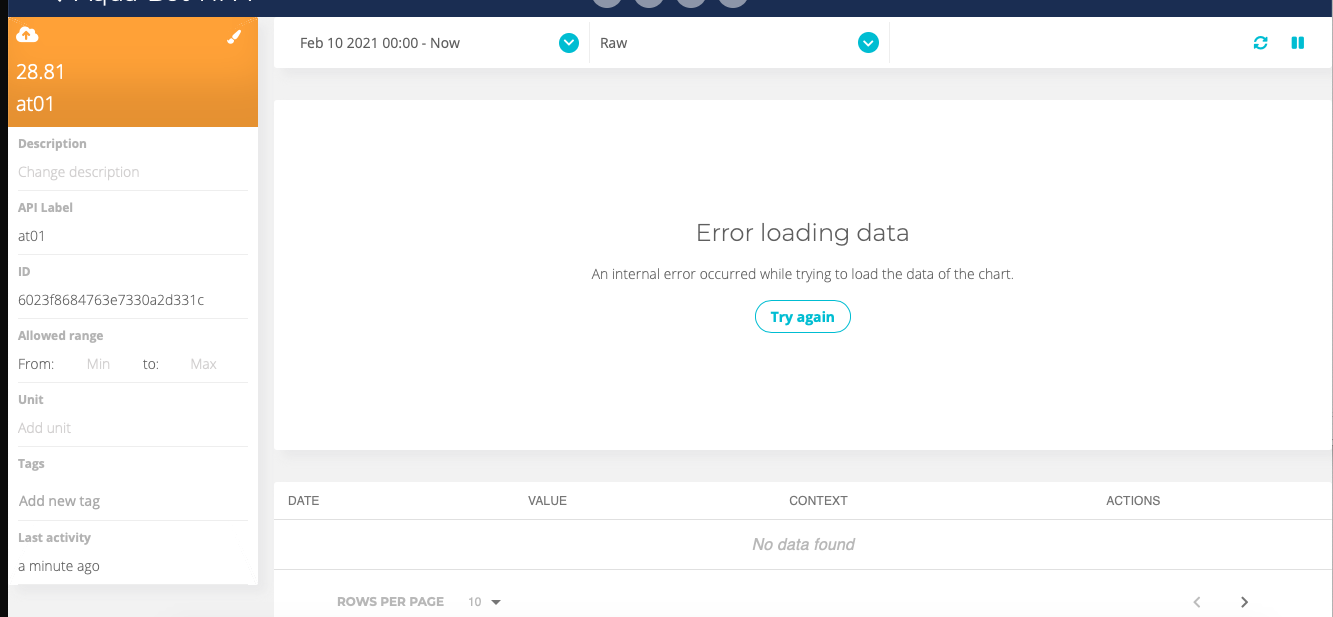
Error Loading Data.
An internal error occurred while trying to load the data of the chart.
I also now deleted all my variables to to see if it helps and uploaded new data - still getting An internal error occurred while trying to load the data of the chart.
Can you please make sure if you have reach the dots out limit for the day? If that the case, please let me explain and clarify how the dots out and in consumption works:
Dots in : All the dots received and saved from any channel, Dashboards, and API.
Dots Out : The sum of the dots extracted through two (2) outbound channels.
API : Data requested by external applications or devices from our API. Meaning each value extracted using any of our supported protocols (MQTT, HTTP, TCP/UDP).
Front-end: Data requested by the web interface (Dashboard and devices). This includes all the queries required to render dashboards, CSV reports, variables, etc. Having that in mind, yes refreshing a Dashboard, or exporting data will consume dots out.
Both consumptions are visible in the profile usage by the end of the day. The count reset at UTC 00:00, meaning the values of today are the ones from yesterday, we have an internal ticket to modify this behavior and reflect the values of the respective day. I will keep you posted on the updates of this ticket.
Additionally, below you can find some of the measures you can take to avoid reaching out to the daily limit.
Refresh the Dashboards only when necessary.
Set a short time in the Default time range of the Dashboard, so the first time you open the Dashboard, this one only requests the last data.
Reduce the frequency of data extraction through API.
Finally, I went ahead and increased your dots out capacity to 400,000 per day, to avoid you hit any limits during your IoT application’s development.
I hope my note clarifies your concerns and let me know if you have additional comments.
Thank you very much for the quick response!
I had a look now and still no data showing. It might be the daily limit, I will decrease the dots captured and uploaded, but at this point I cannot see what my daily usage is as for the last usage shown is from the 6th Feb although today is already the 10th.
My system seems to be working again - reduced my dots also now to only upload one dot per sensor per hour. Once the daily usage graph works again I will adjust my dots.