Hi all,
I have a request and im not sure if this is something that exists, to my knowledge it does not.
The feature I would like to see is all the graph widgets react on the same adjustment to the x axis (time), this would make it easier to dive into the data as all graphs would show the same time range.
Is it possible to have a zoom that zooms on all graphs or to synchronize graphs time with each other.
(Zoom on one graph would zoom on all graphs)
Thanks.
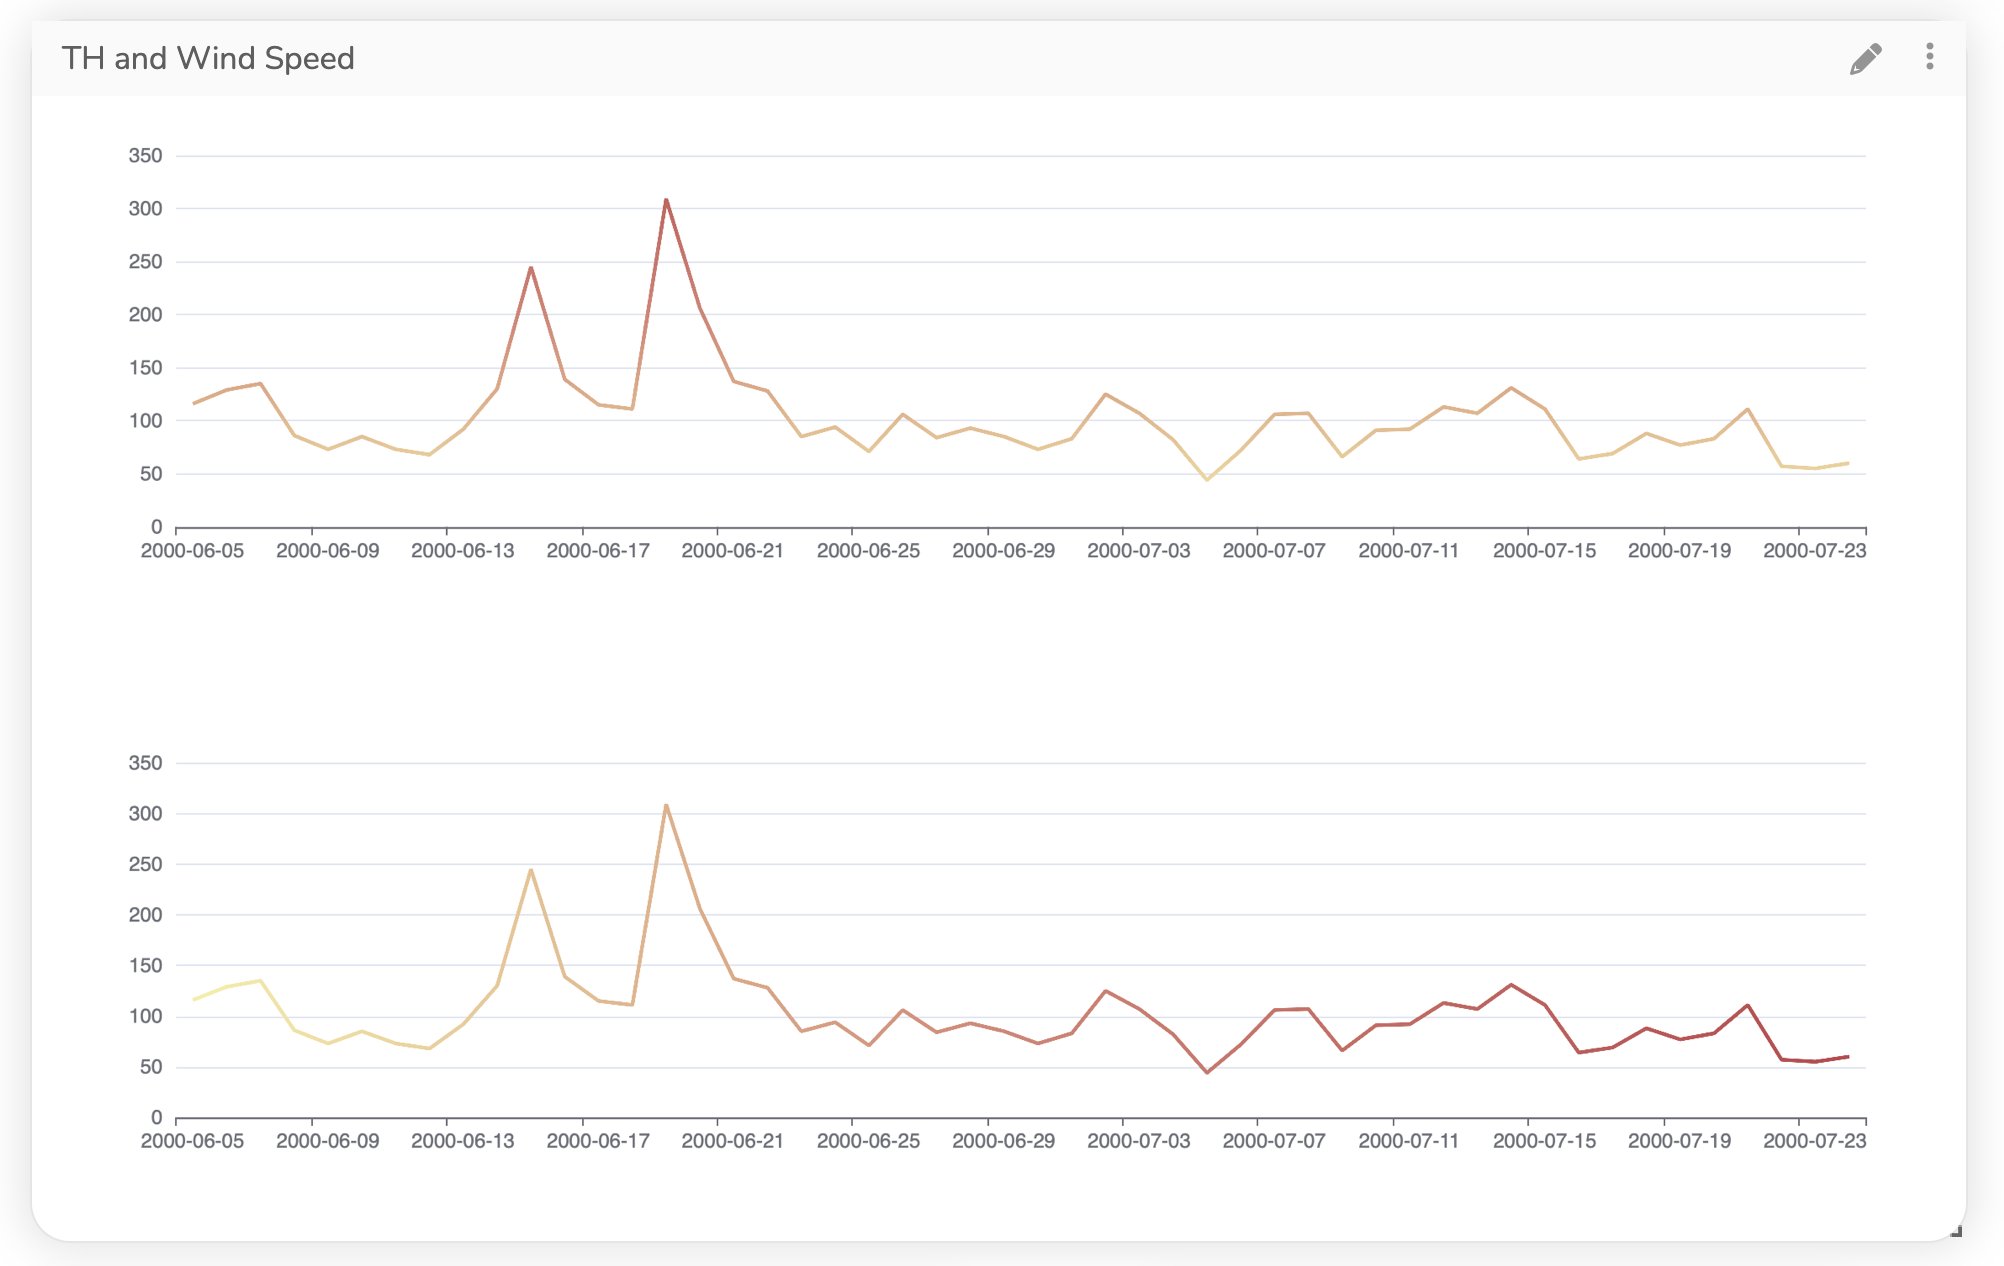
This would be a great addition, thanks. While it is not planned to sync independent line chart widgets to react to a single hover/zoom gesture in one of them (we tried it before and it didn’t perform as expected due to limitations in the library we use), it would be possible to create an option in the line chart widget (or a new widget) to separate all charts and have them share the X-axis, for example:
Would something like solve your use case?
Hi,
Thanks for the good detailed answer,
This solution might be a able to solve our case, It would have been great to have multiple lines in the same graph as 8 graphs might be a little much on a dashboard.
Does this feature already exist in a widget?
Greetings @ChrisManoe, I hope you are doing great.
As mentioned above, currently there is no feature that allows you to synchronize multiple line charts’ time axis.
However, a solution to what you mentioned (“It would have been great to have multiple lines in the same graph”):
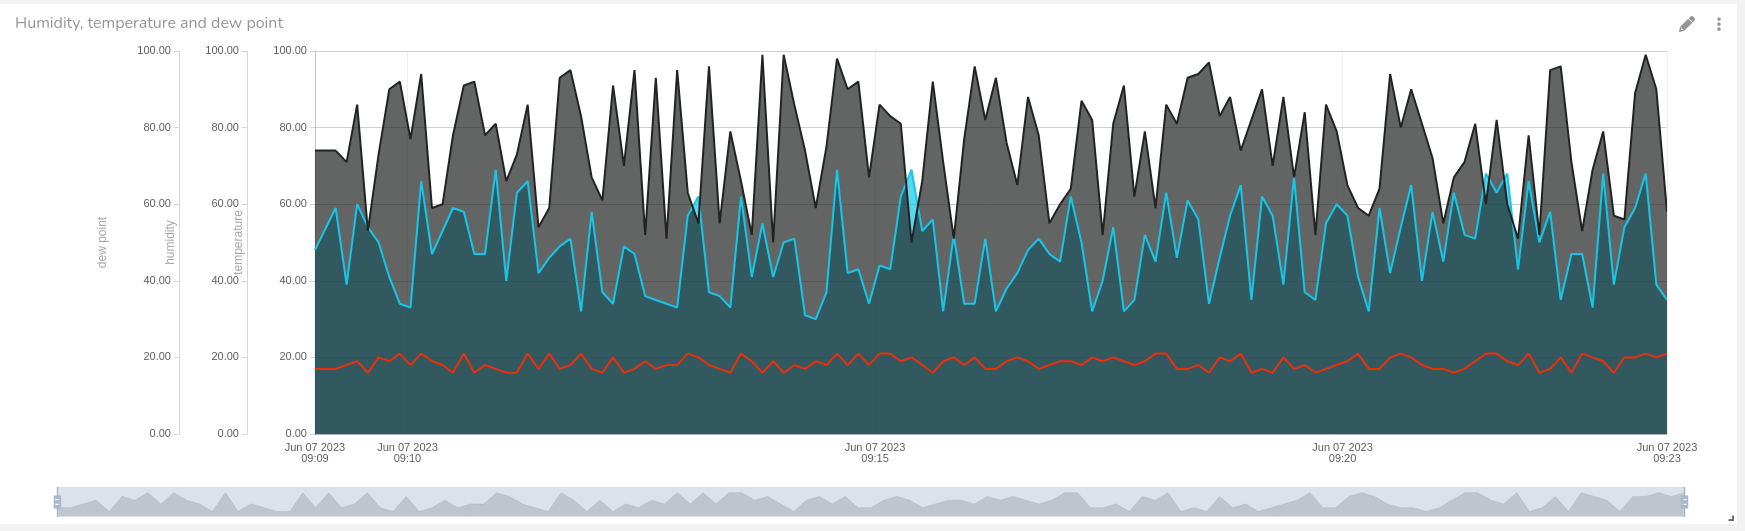
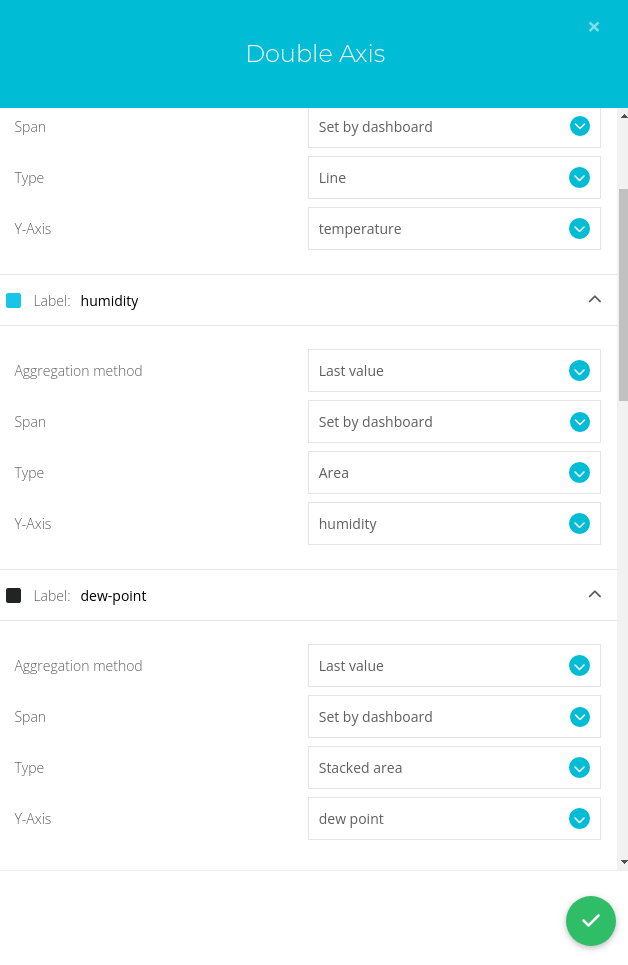
Is to use Double Axis Widget. It allows you to display multiple variables in the Y axis, while using the same X-Axis, namely time.
Below is a screenshot of a Double Axis Widget displaying temperature, humidity and dew point values.
It has quite different configurations settings such as changing the aggregation method, the time span, graph as dots, lines, stacked area, etc.
I hope this finds you well on your IoT journey. Best regards.
-Juan David