How to monitor your Internet connection using OpenWrt and Ubidots

Is your Internet provider delivering a good quality service? If the answer is “no”, then how can it be measured? A nice way to get a sense of your Internet’s quality is to ping a remote host and watch the response times. This is what we call “Latency”.
This guide explains how to use an OpenWrt router to log the response times returned by the PING program, and send these times to the Ubidots cloud.
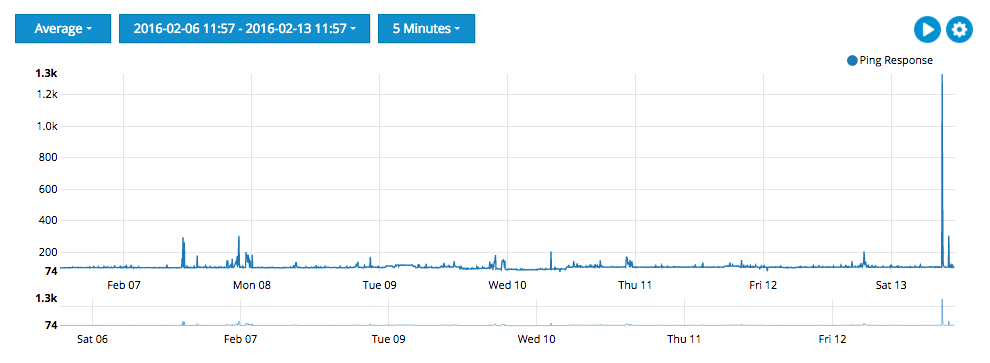
At the end of this tutorial, you should be able to create an embeddable graph like this – by the way, this is the actual data from our Internet connection:
OpenWrt is a Linux distribution for your router. As a Linux box, it allows you to manage packages and setup services like VPN’s, SSH, Telephony, etc.

However, it runs on limited hardware and each service should be as light as possible. This is why we’ll use Lua, a powerful, fast, lightweight language that is mostly used for embedded devices.
Step 1: Setting up your Router
To complete this guide you will need an OpenWrt capable router. You can find a list of supported routers in their website. Follow the router-specific instructions to flash your device.
Note: This tutorial has been done and tested with OpenWrt version 10.03.1 (Backfire).
Step 2: Install the required libraries
Our program will use two Lua libraries:
LuaSocket: Contains the methods to create HTTP requests.
LuCi JSON: A set of utilities to handle JSON objects.
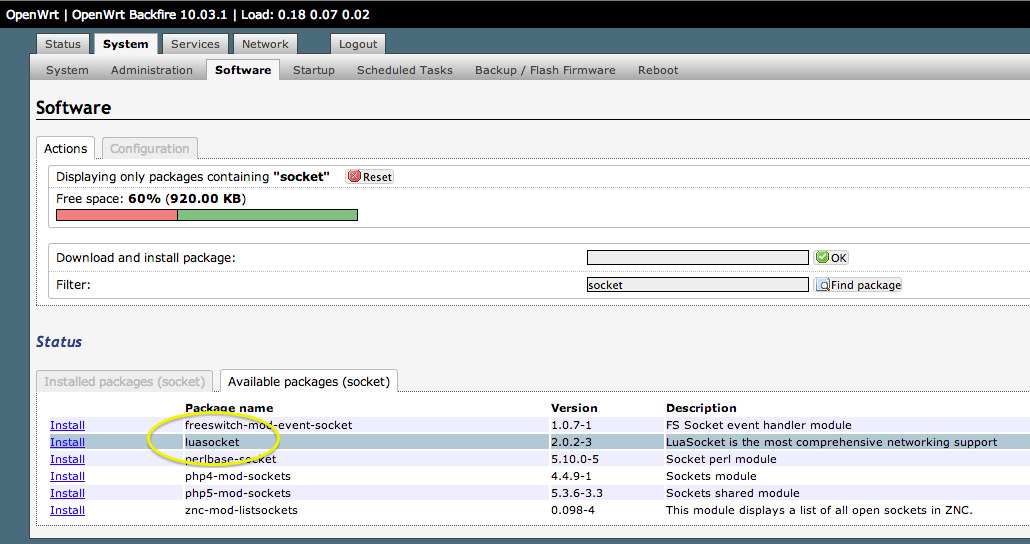
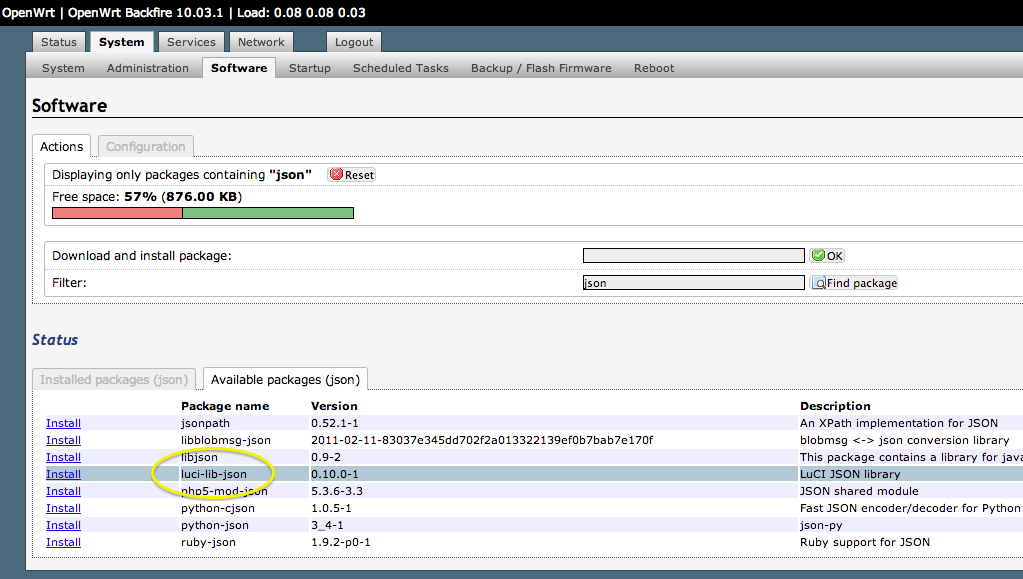
To install these libraries you can access your router through the web interface, navigate to the “System” tab and then click on the “Software” option. Finally, locate the required libraries and install them:
Alternatively, you can log in to your router via SSH and use the ‘opkg’ package management tool from the console to install the packages:
opkg install luasocket luci-lib-json
Step 3: Prepare your Ubidots account
Open your Ubidots account, navigate then to the Sources tab to create a Data Source called “Openwrt Router” and then a variable called “Internet Latency”. Take note of the “Variable ID”, which we’ll need to put in our Lua code:
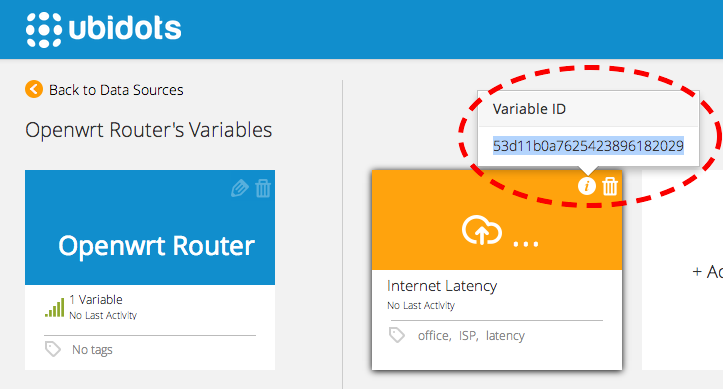
Create a permanent TOKEN under your profile tab and take note of it – we’ll also need it for our Lua code.
Step 4: Coding your Router
We’ll write some code to measure the Internet latency and then send it to Ubidots.
In order to write a program on your OpenWrt device, you must be logged in through SSH. Let’s begin by creating a configuration file called ‘config.lua’ to store some parameters:
mkdir /root/ubidots
cd /root/ubidots
nano config.lua
Insert the following code, replacing your Token and Variable ID with the ones from your Ubidots account:
local conf = { variables = { ['52d481d9f91b284cd22af757'] = '8.8.8.8', },
-- Add one variable id per each site to check the ping token = '9xtbvHL8hFKxfkmlXUW3qNoUpOEZAtp0qkkwPqffbn6DiR3ElRJ4B5m1hZMs',
--Replace with your own token host = 'industrial.ubidots.com', -- Host to establish connection port = '80',
-- Port where service is listening
} return conf
Where:
- variables: You can list individual variables, each one representing the Ubidots’ ID and the host to which the PING should be made to. For this example, we’ll use our variable’s ID and the host “Google.com”.
- token: A fixed token generated in your profile tab.
- host: The host to which the HTTP requests will be made to. Ubidots’ API address in this case.
- port: Port where the host is listening. 80 by default.
We are now ready to create the main LUA program to measure and send out the latency. Create a file called “ubidots_ping.lua”:
nano ubidots_ping.lua
Insert the following code into the created file:
!usr/bin/env lua

-- Loading main configuration
local config = require "config"

-- Library to read command output
local io = require "io"

-- Load the http module
local http = require "socket.http"

-- loading ltn12 and json libraries from luci framework
local ltn12 = require "luci.ltn12"
local json = require "luci.json"
local host = string.format("http://%s:%d", config.host, config.port or 80)

-- Getting the retrieved token
for var_id, var_ip in pairs(config.variables) do print(var_id, var_ip)

local f = io.popen(string.format('ping -c 1 -W 4 %s | grep ttl', var_ip))
local l = f:read("a") f:close() local rtime = '-1' if l ~= '' then

-- Getting response time from ping output.

rtime = string.match(l, "time=(%d+.%d)") end print(rtime)
local dtime = string.format('{"value": %s}', rtime) print(dtime)

-- Post value to retrieved variable
local rsp, code, tr = http.request{
    url=string.format("%s/api/v1.6/variables/%s/values/", host, var_id),
    method = "POST",
    headers = { ['X-Auth-Token'] = config.token,
        ['Content-Type'] = "application/json",
        ['Content-Length'] = string.len(dtime) },
    redirect = true,
    source = ltn12.source.string(dtime),
    sink = ltn12.sink.file(io.stdout)
}
end
Last but not least, let’s make sure the program has the right permissions:
chmod +x ubidots_ping.lua
Finally, let’s run the application once to make sure it’s working:
lua ubidots_ping.lua
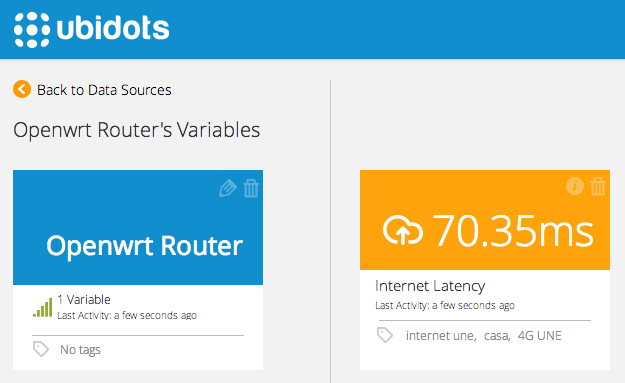
If everything went well, you should be able to see a response in JSON format and then see the posted value in your Ubidots account:
Step 5: Setup a Cron job to send data every minute
Once you make sure the script is working, create a cron job to automate the measuring and posting of latency values.
You can edit the OpenWrt’s cron table through the SSH console:
crontab -e
Create an entry that calls your program every minute:
cd /root/ubidots/; lua /root/ubidots/ubidots_ping.lua >> /dev/null
Save your changes and verify the program is sending data every minute.
Now that you have this data in Ubidots, navigate to the “Dashboard” tab in your account and create a Line chart widget like the one at the beginning of this page. You can also create Gagues, scatter plots to compare the latency against another variable (say, speed?), and many other types of real-time widgets.
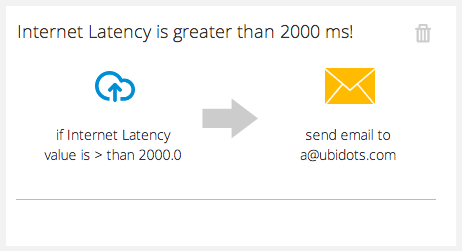
You may also create SMS or Email alerts when the latency is getting too high:
Wrapping up
In this example, we were able to measure the Internet Latency experimented by an OpenWrt router. We learned how to use the Lua programming language to send a value to Ubidots, enabling you to connect any type of Lua-powered device to our cloud.
You can also use Ubidots to stream other types of time-series data, such as signal levels, noise levels, GPS, etc. You might want to check out these other examples:
- Building a people counter with Raspberry Pi and Ubidots
- Creating a real-time map without writing any web code
Do you have more project ideas? Create a Ubidots account and make them happen!


