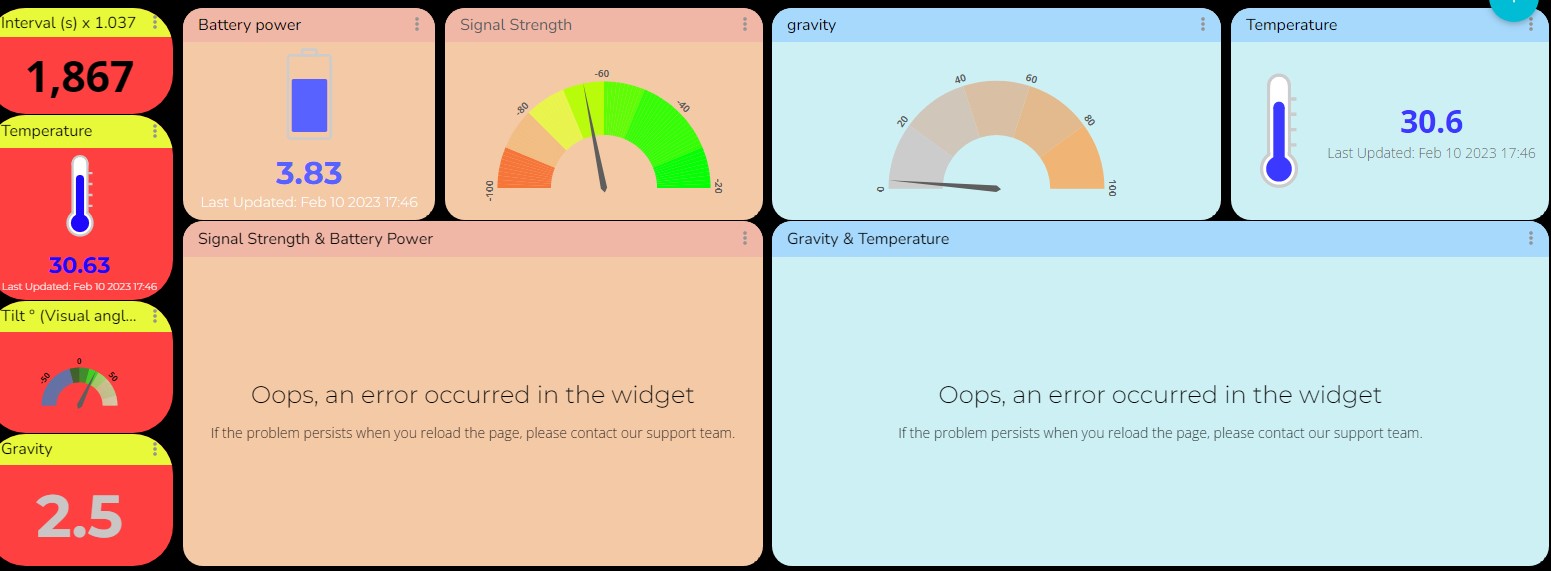
When I open my dashboard, the 8 metric widgets appear to be working properly, but the 2 Double Axis widgets appear blank (in my custom style colours) with the message “Oops, an error occurred in the widget”.
These widgets were previously working properly. My data usage is good. I have not changed any variables, but, on the device page, I can not load any data if the span is set greater than the last 30 days.
Can anyone please help?
1 Like
Hello, @Stevotosh7
Thanks for reaching out,
We are looking into the situation reported. Once We have a more solid answer with regards to this problem I will get back to you.
Regards,
-Santiago
2 Likes
Hello @santiago
Thank you for your response and consideration.
About 48Hrs ago my dashboard returned to normal with the addition of a broken white border around it.
All widgets, including the problematic chart widgets are now working properly.
I did not reply to you immediately, as there is another person (there may be others, of course) who experienced the same problem, and I wanted to check with them first to ensure that their dashboards are also functioning properly.
His post is here.
I will continue to monitor it and will reach out again on this topic if the problem reoccurs.
I thank you again for your support.
Regards,
Steve
1 Like
Hello, @Stevotosh7
Thanks for getting back to us. I forgot to notify you earlier this week that after we acknowledged this problem, our Development made a hotfix and the dashboard is working now. We are sorry for the inconvenience caused.
Regards,
-Santiago
1 Like