Hi. I’m getting the message “You’ve retrieved 500012/500000 dots today” on my dashboard. My usage report shows Dots Out (Core) 134,403, and Dots Out (API) 266,315 which doesn’t add up to 500,012. I haven’t seen anything on my dashboards today, so I don’t understand how the Dots out were generated. I have removed the graphs from my dashboard hoping it will reduce the pull of data.
My device is an iSpindel, and I really need to get some readings from it.
1 Like
Hi.
Got the same problem with the same type of device this morning.
Is been running for days with no issues, but had a warning banner with about 471,000 dots extracted today, and, within a few minutes had exceed 500,000 and allowing no further retrieval.
When this happens, data stops coming in as well. I see in the consumption report that there are zero dots in since the day after the problem started. Also, the day after the problem started the number of devices dropped from 1 to 0.
This only happened today and the device I have still appears to be collecting data, so I can see the current values at least.
What’s your battery reading?
4.1762v…but… The over limit message has now disappeared and the dashboard is also working again.
Seems to have sorted itself out over the last 2 hours, unless Ubidots intervened.
My total dots out has also jumped from around 500K when I had the issue to over 1 million now, so does look like the spike did happen, but my daily quota has been reset.
Good day @Palazzo13 and @axelwolff
I hope you are well. Thank you for sharing your concerns, we certainly don’t want to be a bump in the road for your IoT initiatives. Let me explain and clarify how the dots out and in consumption works:
Dots in : All the dots received and saved from any channel, Dashboards, and API.
Dots Out : The sum of the dots extracted through two (2) outbound channels.
- API : Data requested by external applications or devices from our API. Meaning each value extracted using any of our supported protocols (MQTT, HTTP, TCP/UDP).
- Front-end: Data requested by the web interface (Dashboard and devices). This includes all the queries required to render dashboards, CSV reports, variables, etc. Having that in mind, yes refreshing a Dashboard, or exporting data will consume dots out.
Both consumption are visible in the profile usage by the end of the day. The count reset at UTC 00:00, meaning the values of today are the ones from yesterday, we have an internal ticket to modify this behavior and reflect the values of the respective day. I will keep you posted on the updates.
Additionally, below you can find some of the measures you can take to avoid reaching out to the daily limit.
- Refresh the Dashboards only when necessary.
- Set a short time in the Default time range of the Dashboard, so the first time you open the Dashboard, this one only requests the last data.
- Reduce the frequency of data extraction through API.
Finally, the product team has decided to partially remove some consumption from the dots out daily count. I said partially, as Dots out currently involves consumption from Dashboards, Data exports, Reports and API (retrieving data from 3rd platforms or your devices), so for the sake of not blocking you and your projects, Dashboards, Data exports, and Reports will no longer generate Dots out consumption. This implementation is in progress so it will take additional days to reflect this change in the account. Please note that retrieving data through the API will still generate Dots out consumption.
All the best,
-Isabel
Thanks @isalogi.
My issue was that, despite only using an interactive dashboard, my daily limit was exceeded today for some reason by 05:00 UTC. My “Core” Dots out for the last 4 days says:
80,977 91,679 350,454 500,229
I can’t explain the big jump yesterday, and why at 05:00 UTC I was locked out as over limit, yet at around 7:50 UTC I was able to get data again. All is fine now.
Edit: Though now just seen a message at bottom of the web screen saying I’ve “You’ve retrieved 459140/500000 dots today.”. very odd as I have no browsers currently running on the dashboard.
This is not an issue of refreshing the dashboard too often or having a graph with too long a period. I have removed all graphs and only have single variables on the dashboard. Since the problem started a couple of days ago, I don’t get anything, neither in nor out. The consumption data claims there are 500012 dots out, but I don’t see anything on the dashboards, not even the first time I open the portal in the morning. I haven’t made any applications requesting data through the API. So I don’t think I am overconsuming, I think something is seriously wrong. Please look into my account: axelwolff.
1 Like
Good day @axelwolff and @Palazzo13
Thank you for your patience while I was reviewing your report. Indeed we detect that there is an issue counting dots out in the Dashboard side when the real-time option of the Dashboard is paused. We are already working on the solution and we are sorry for the inconvenience this may cause. As I mentioned in my previous note the product team has decided to remove the dots out generated by Dashboard and the implementation is in progress. I will let you know as soon as I have an update.
All the best,
-Isabel
1 Like
Isabel
Thank you for considering my problem. All consumption metrics are down to zero, but I still don’t get any readings. To be fair, it might be because my device died, I can’t check that until tomorrow, but to be honest, I doubt it, since there were dots out a few days ago, but I haven’t gotten one reading since February 28th.
Hi @axelwolff ,
I hope this note finds you well. Did you have the opportunity to check the correct operation of your device? as the issue with in the dots out consumption in Dashboard shouldn’t affect the reception of data from your device.
Let me explained in detail what the issue that was. Currently, each Ubidots Dashboard has 3 buttons on the upper left side.
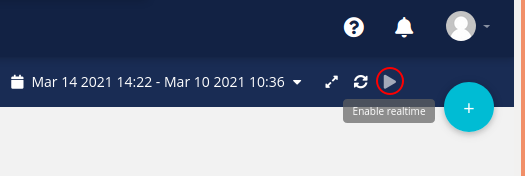
One of those buttons is a play and pause button that enables the real-time of the dashboard which means updating the data of the widgets based on the new data that is being received in the variables. For example, if you have the dashboard open, with the real-time enable the widget should update its values to show the new ones, which generate dots out consumption.
Now, the issue was related when the real-time option was paused and there was one widget or more with an aggregation method configured.
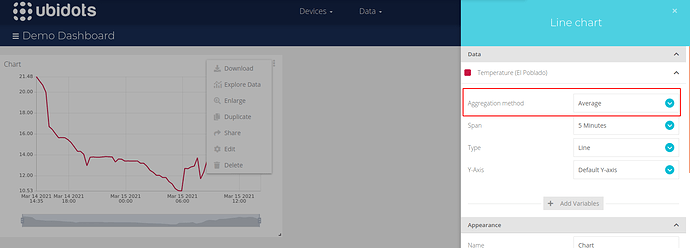
In this scenario, the Dashboard should not generate dots out as the real-time option is disabled which implies that the dashboard will not update based on new data. Unfortunately, consumptions were being generated in these widgets when new data was received in the variables, even though the widget did not update its value on the dashboard side. The team has already deployed a solution for this issue and we are currently monitoring its correct operation. We apologize for any confusion and inconvenience.
Please let me know if you have further questions.
All the best,
-Isabel
Isabel
Thank you for your patience and kind assistance. I am happy to report that after charging my device, I was able to again retrieve readings.
I must say though, that the Usage logs are hard to read and understand.
Thank you for helping to clear things up.
Hi @axelwolff,
Thank you for your response and confirmation regarding your device. I will share your comments with our product team so they can evaluate how to facilitate the understanding of the usage logs for users.
Have a nice rest of your day!
– Isabel
Hi,
Looks like I’m having the same or similar problem, I can’t visualize any data since 14th May on the dashboard and I had a widget thas was doing averaged data
See attached capture of the data usage
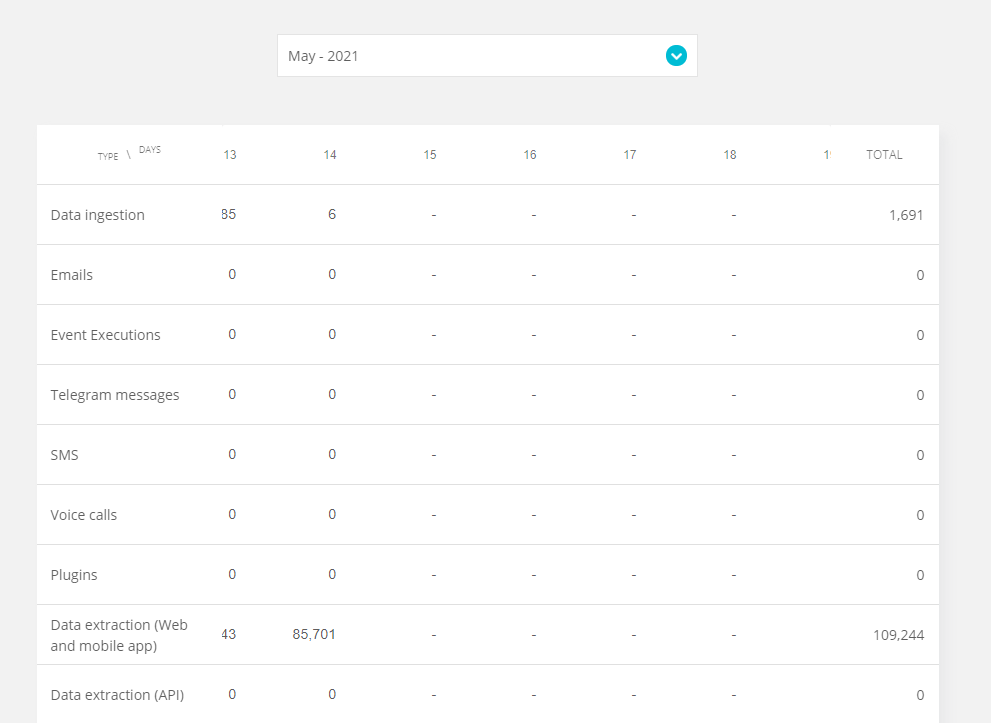
Could you please check what is happening or what I am doing wrong?
Thanks
Jordi
1 Like
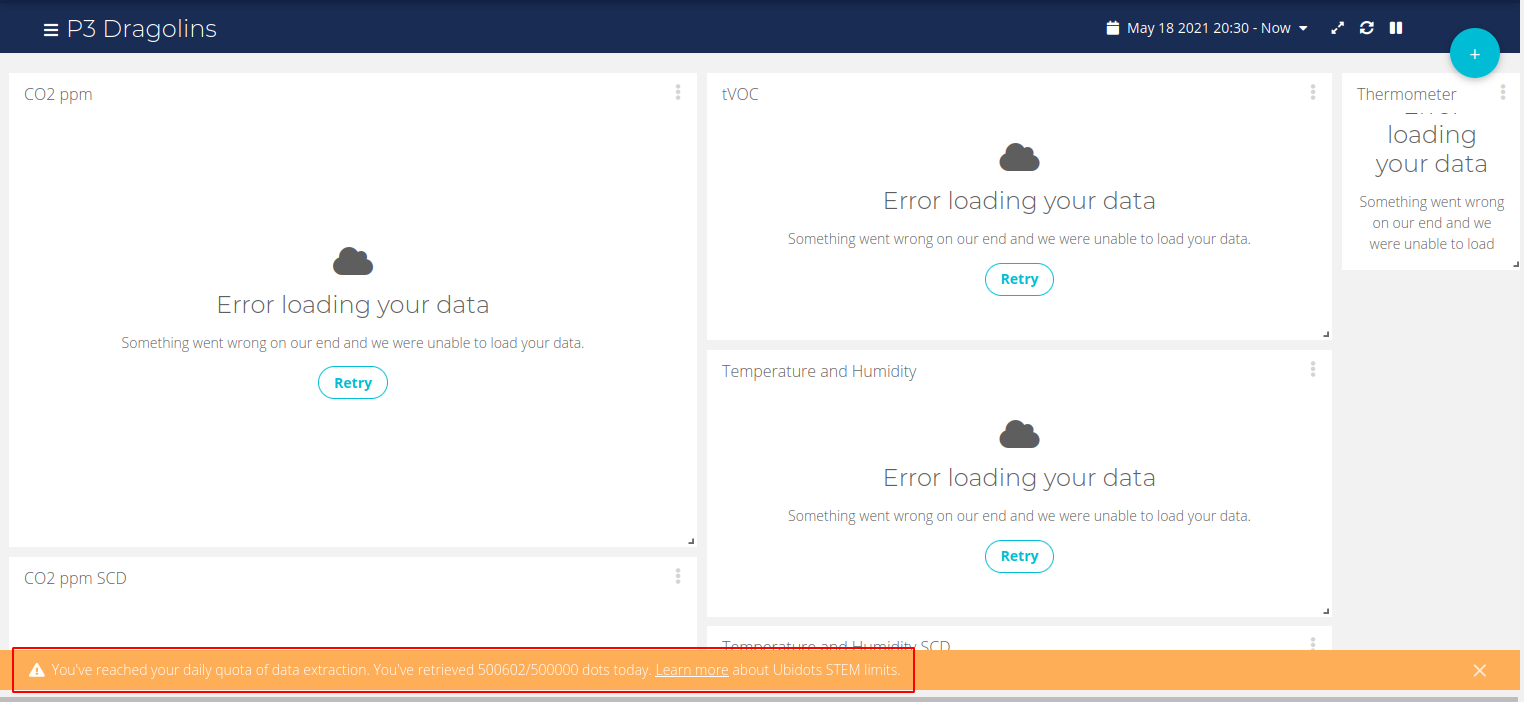
Hi @jordimercader,
You reached the limit of dots out included for the day.
Can you please let me know how frequently are you sending data to the variable related to the widget? additionally, can you please share an image of the widget settings please? with that information we can help you minimize the consumption of dots to avoid hit the limits. I went ahead and increase the daily dots out quota, so you can check the dashboard and let us know the above information.
Best,
-Isabel
I have the same issue. My daily quota had a warning two days ago, and it just kept climbing each day. I now have the same “Error loading your data” in my widgets. I’m only sending updates every 900 seconds.
Hi Isabel,
Thanks for your answer, I was sending data too frequently at first (every 2 min) and left the dasboard opened at real-time before reading about the dots limit.
I fixed that should be fine from now on. Although I’ve made a query with the old data and I think I may have exceeded the quota again… my mistake.
It would be good to have a dots counter or warning message to avoid this situations, it is difficult sometimes to realize how big is your data when querying several variables at the same time
This is the widget config if it helps:

Again thanks for your help
Best regards
Jordi
Hi, I need help with my account, I have the same issue.
It says I exceeded the quote limit, but I don’t have that amount of data…