For the sake of clarity, I think it worth pointing out that it is not just the particular case of my account - I can find at least six posts on this forum stretching back to June that have experienced the same problem.
Thank you for increasing my dots again. In case it helps your investigation, I have just had a notification: “You’ve retrieved 701772/700000 dots today”
I have not used the system any more than any other day.
After sharing your case with our team and understating how frustrating could be to no be able to access your account data for reaching the dots limit, we decided to explore how to make the consumption visible and predictable to our users, until then, you don’t need to worry to reach out the limits again.
This should be happening only if you have the Real-Time option available or if you are making GET requests via API. Please let me know if none of the below is the case to further investigate based on your findings.
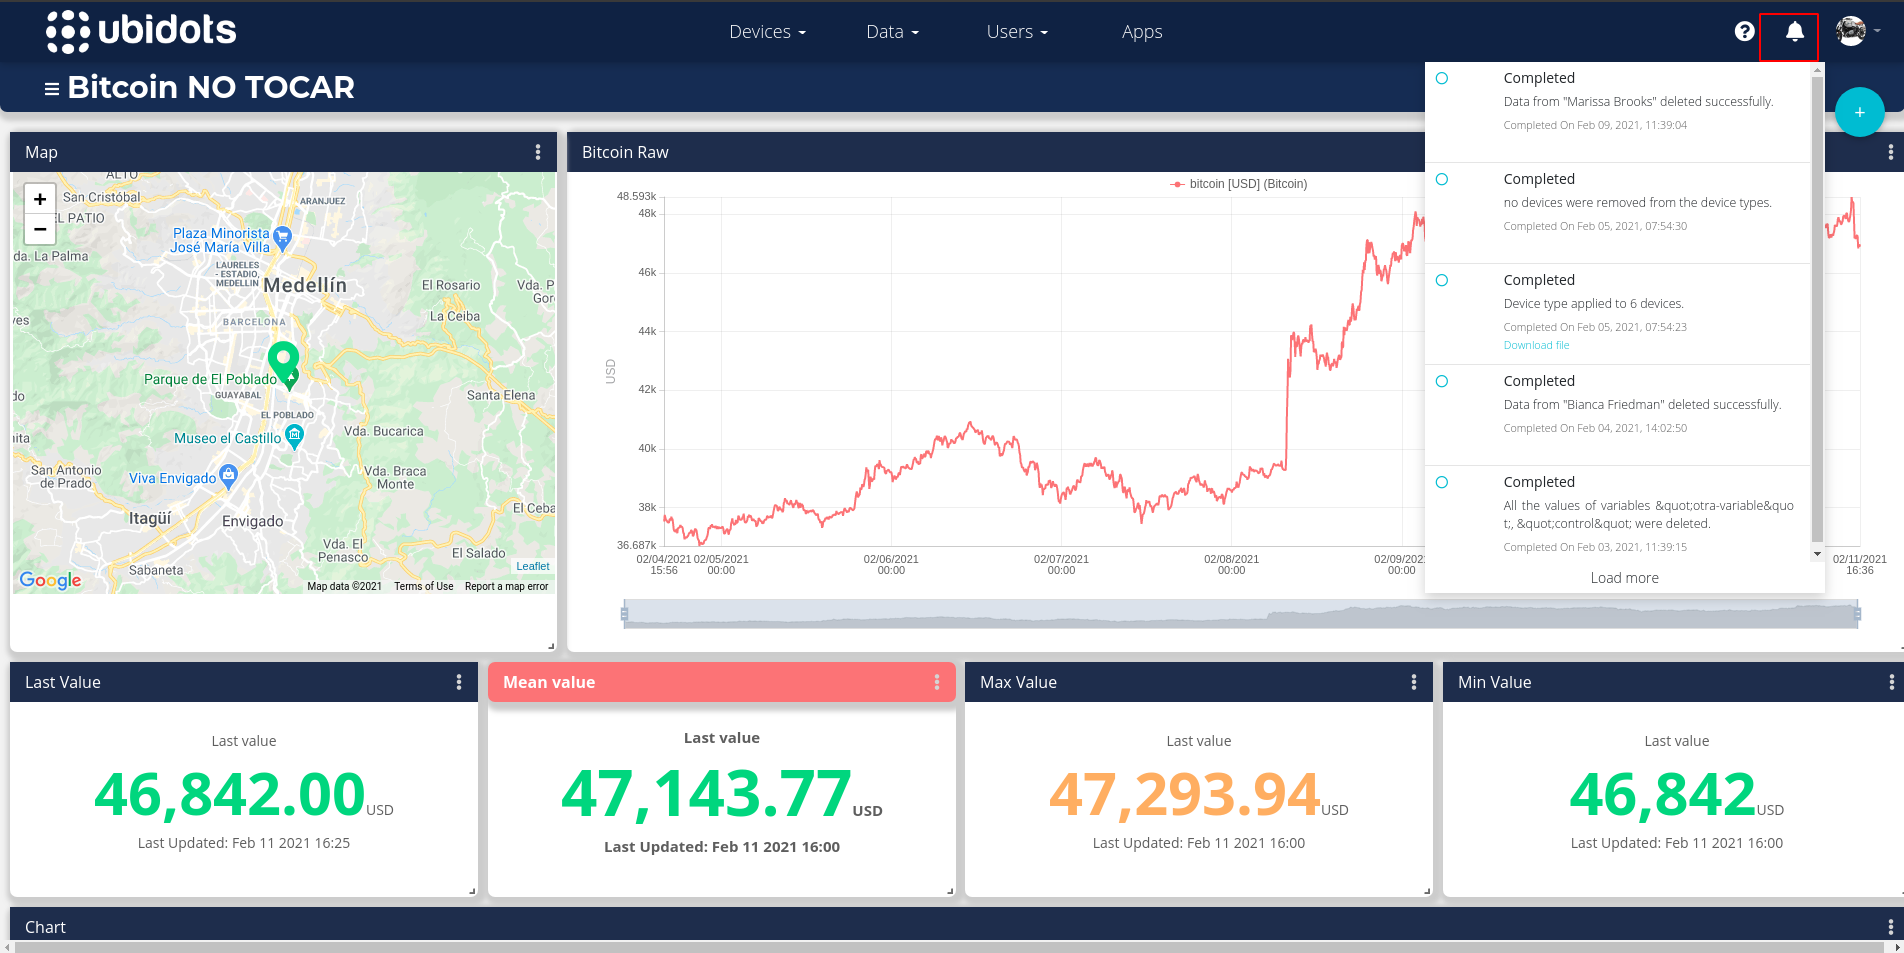
For the second time, we put a log to detect your account consumption and found that you are indeed making those dots out consumption through Dashboards. As you can see in the following image, all consumption comes from the same dashboard via Real-Time, which updates the data and recharges successively. Please rectify that you don’t have the Real-time enable and the amount of data the widgets are asking for is from a short period to ensure you don’t exceed the limits again.
Additionally, as I mentioned in a previous note, the product team has decided to partially remove some consumption from the dots out daily count. I said partially, as Dots out currently involves consumption from Dashboards, Data exports, Reports and API (retrieving data from 3rd platforms or your devices), so for the sake of not blocking you and your projects, Dashboards, Data exports, and Reports will no longer generate Dots out consumption. This implementation is in progress so it will take additional days to reflect this change in the account. Please note that retrieving data through the API will still generate Dots out consumption.
I can categorically confirm that real-time is not enabled. At least not by me. I have never had it turned on.
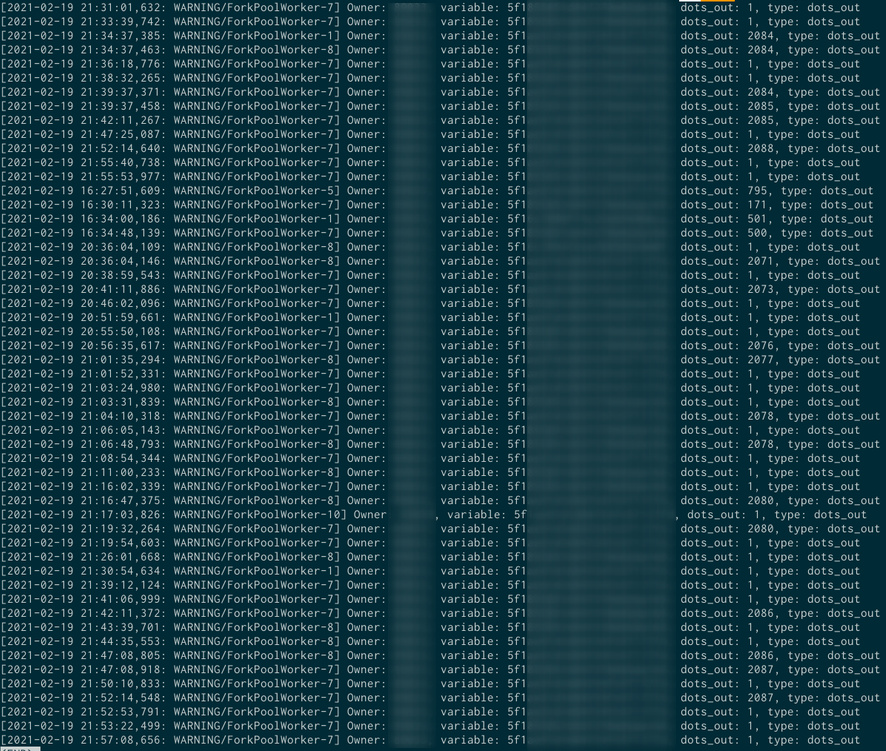
You will also know from earlier posts that I have had Network Sniffer running since early February. It did not detect the API calls that your screenshot shows. So the calls were not generated by me.
I assume the screenshot shows the result of Dots Out from a dashboard (as opposed to the Devices overview page or an individual device page).
At 2021-02-19 21:31 (the top line of the image) my dashboard would have pulled 6 data sources. 4 were single data points and 2 were a date range starting from 2021-02-09 22:04. This equates to 479 values for the two date ranges and 4 values for the other 4. I have confirmed this by directly pulling the JSON using curl.
Your image seems to have a number of values (and, weirdly, dates out of order). I am not sure how to correlate the dots_out value as shown in the image with the JSON. Even assuming somehow I had real-time tuned on it does not seem to match up.
Values of 2084, 795, 171, 501, etc bear no relationship to reality. Where do these come from?
Thank you for your report and detail explanation of your dots out consumption. After a detailed review of the dots that were being generated by your Dashboard, we were able to detect that there is an issue counting dots out in the Dashboard side when the real-time option of the Dashboard is paused. We are already working on the solution and we are sorry for the inconvenience this may cause. I will let you know as soon as I have an update.
That is great news. I am glad that you have found the bug as it has proven to be a frustrating experience and one that has clearly affected many users.
In case it helps your analysis, I ran a test over the last few days.
My device - an iSpindel - generates 1776 data points per day (6 metrics every 00:04:51). There are also two calculated (synthetic) data points. This should be another 592 data points.
I set up a test whereby I set the time period of my dashboard to be a fixed 24 hours (midnight to midnight) on a date in the past. I have 5 widgets: 4 are single data point and one uses a 30 minute average of two data points. Thus the 5 calls (https://stem.ubidots.com/api/v1.6/widgets/5f183xxxxxxx/data?tz=…) generate 100 data points exactly: 4 + 48 * 2. I confirmed this with a manual curl script.
Question 1: The Dots In tallies (1776) with your usage report. However the “Dots Out (Synthetic variables)” is showing 988. Why not 592?
Question 2: On two separate days I performed a single refresh of the dashboard. On each occasion the Dots Out is given as 596. Why has it overcounted by 496?
Please find below the answer to the questions of your initial reply.
Question 1: The Dots In tallies (1776) with your usage report. However the “Dots Out (Synthetic variables)” is showing 988. Why not 592?
The dots out generate by synthetic variables vary depending on the expression, as in some cases it is necessary to request more than one dot from the raw variable to calculate the expression, additionally each time a new data arrives to the raw variable, the synthetic variable computes a new value. It is also important to bear in mind that although this consumption is shown in the usage of the account, it is not taken into account in the total count of dots out included in the accounts.
Question 2: On two separate days I performed a single refresh of the dashboard. On each occasion the Dots Out is given as 596. Why has it overcounted by 496?
Now, the issue in counting the dots out on the dashboard side happens when there is a widget that has an aggregation method configured and the real-time of the dashboard is paused if the dashboard is still open when new data arrives to the variable, dots out are generated even though there is not any actualization needed. The team is already in the process of solving this problem and we apologize for any frustration or confusion. I hope to have an update by the end of the week.