I am getting the very unhelpful, “Error loading your data. Something went wrong on our end and we were unable to load your data”, which I have learnt by trial and error means that the Dots Out limit in my STEM account has been exceeded.
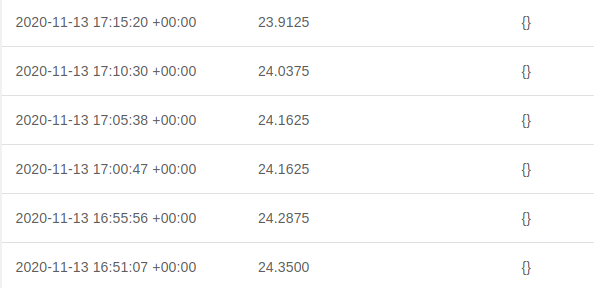
I have not used Ubidots today (27th October) and only do so through the web UI. But the Usage report shows a figure of 52,281 Dots Out for the 27th.
According to another forum post this figure is updated at 00:00 UTC for the previous day which means there should be no figures against the 27th. See screenshot below. This is the second time in the last few days this has occurred.
Thank you for sharing your concerns, we certainly don’t want to be a bump in the road for your IoT initiatives. Let me explain and clarify how the dots out and in consumption works:
Dots in : All the dots received and saved from any channel, Dashboards, and API.
Dots Out : The sum of the dots extracted through two (2) outbound channels.
API : Data requested by external applications or devices from our API. Meaning each value extracted using any of our supported protocols (MQTT, HTTP, TCP/UDP).
Front-end: Data requested by the web interface (Dashboard and devices). This includes all the queries required to render dashboards, CSV reports, variables, etc. Having that in mind, yes refreshing a Dashboard, or exporting data will consume dots out.
Both consumptions are visible in the profile usage by the end of the day. The count reset at UTC 00:00, meaning the values of today are the ones from yesterday, we have an internal ticket to modify this behavior and reflect the values of the respective day. I will keep you posted on the updates of this ticket.
Additionally, below you can find some of the measures you can take to avoid reaching out to the daily limit.
Refresh the Dashboards only when necessary.
Set a short time in the Default time range of the Dashboard, so the first time you open the Dashboard, this one only requests the last data.
Reduce the frequency of data extraction through API.
Finally, I went ahead and increased your dots out capacity to 400,000 per day, to avoid you hit any limits during your IoT application’s development.
I hope my note clarifies your concerns and let me know if you have additional comments.
Than you for your reply. Let me answer each of your questions in the same order.
As the consumption of 27th is the one from the 26th. Today you should see the number of dots consumed on the 27th based on the Coordinated Universal Time. Can you please let me know if this value is the one you expect? Otherwise, I will investigate what could be happening.
Yes, at the moment given that the count resets at 00:00 UTC, the consumption of 26th is being reflected on the 27th. We already have an open ticket to address this case, to reflect the consumption of the corresponding day. I will keep you informed of the state of the solution.
Sorry but Q1 is not about the Usage report. It is the fact that yesterday morning (27th) I refreshed the Front-End web UI (the Dashboard) and immediately got the “Error loading your data” message. Note I do not use the API. I had not accessed Ubidots system and yet got this error message.
This is the second time this has happened (i.e. that despite not using the system it posted an error implying that I had exceeded that day’s quota).
Thank you for all this information. Based on your notes I will be going to review your case and investigate the reason behind this number in the dots out consumption. In the meantime, can you please let me know if you have made any data exports in the days in question?
No I did not make any data exports on any of the days.
I leave 5 tabs open in Chrome (but not accessed or viewed) including a dashboard (/app/dashboards/xxx) which does not have real-time turned on, the devices overview page (/app/devices/aaaa) and three individual variable’s pages (/app/devices/aaaa/bbbb).
Please receive my apologies for the delay in replying to your note. Thank you for your confirmation regarding the data export and let me know the number of tabs you have open. I’m investigating in detail the reason for your dots out consumption. Please give me until next week to review your case and come back with a proper answer.
Thank you for your patience while I was reviewing your case. I got ahead and increase your dots out to 500,000 to review your Dashboards and devices without consuming dots from the 400,000 you have. Now, based on your only Dashboard, the widget that is consuming most of the dots is the line chart widget called SG / Temp (30 mins avg), as this widget has two variable associated that calculates the average value every 30 minutes. The frequency of your data sending is approximately 5 minutes, if you have enabled the real-time option in the dashboard, each 5 minutes a dots comes in, both variables of the line chart will calculate the average value. Now, if you have more tabs of the Dashboard open the consumption will increase considerably. Finally, please keep in mind that the count of dots is made in UTC time, meaning that depending on your timezone this could cover parts of two days.
I also request the Dev team to investigate your dots out via API so we can advise the consumption of each channel and advise you possible ways to decrease the value.
I understand your message and I’m doing all that is in my hands to understand why your consumption is so high as you are clarifying that you are not using the real-time option or extracting data from any other channel. Now, last week I made several tests using a STEM account to verify the correct function of the dots out count and I wasn’t able to identify any issue, that’s why I asked the team to analyze your consumption to have more insights and understand the reason of this value. Please receive my apologies for not being clear enough and lead to a misunderstanding. We will get to the bottom of your case, and in the meantime, I increased the dots out includes in your account.
Greetings, dots out consumption are not related to data ingestion coming from your device or an ubifunction by itself, so it does not matter that you turn off your device, as always as any of the actions below is executed your dots out consumption will grow:
Load data in the variables view
Load data in any of your dashboards, including public dashboards that you may have previously shared
Export data to CSV/Excel from your account
Extract data from your devices using 3rd APIs or scripts (like one written in an Ubifunction) using any GET request
Extract data using MQTT subscriptions
With this in mind, there are many ways to reach your daily limit quota and to avoid to be a rock in your development, Isabel has increased recently your dots out limits recently to a higher number, that I would add, a few free STEM users have.
As the limit increase has not been enough to avoid to reach your account limits, I would advise you to check if you have shared any public dashboard link to anyone that may load it several times during the day, to verify that the time span set at your dashboards is not retrieving a huge number of dots (a span of 4 hours would contain thousands of dots, for example) and if any 3rd API is not asking for data from your account.
We will review your data consumption, but as you would understand, we are a small team and must deliver most of our support to customers with a paid license, but I will take your case personally to check if we may give you additional hints about your data consumption.
Please keep posted on this thread, I will update it as soon as I get an answer from our DevOps team.
Additionally, if 500,000 dots is not enough for your application, I would like to know as valuable feedback for us and our plans offering, why you do not consider to get a license to break the STEM limits?
I have turned off my device between 2020-11-13 17:59:03 and 2020-11-26 19:26:30.
During that time I have not accessed anything using any of the techniques you mention. Nobody else has access. The only exception is that I have left a Chrome tab open - but I have not refreshed it - during this time.
According to your usage report during this period (14th - 25th) I have used the following Dots Out: 56,815 0 113,669 8,168 6,904 0 0 0 0 284,048 227,232 0
So for instance yesterday I used 0 (correct) whereas the day before yesterday I somehow used 227,232 despite no access.
I appreciate you must support paid users first but this seems like a bug. If so, it will likely affect others, including paid users.
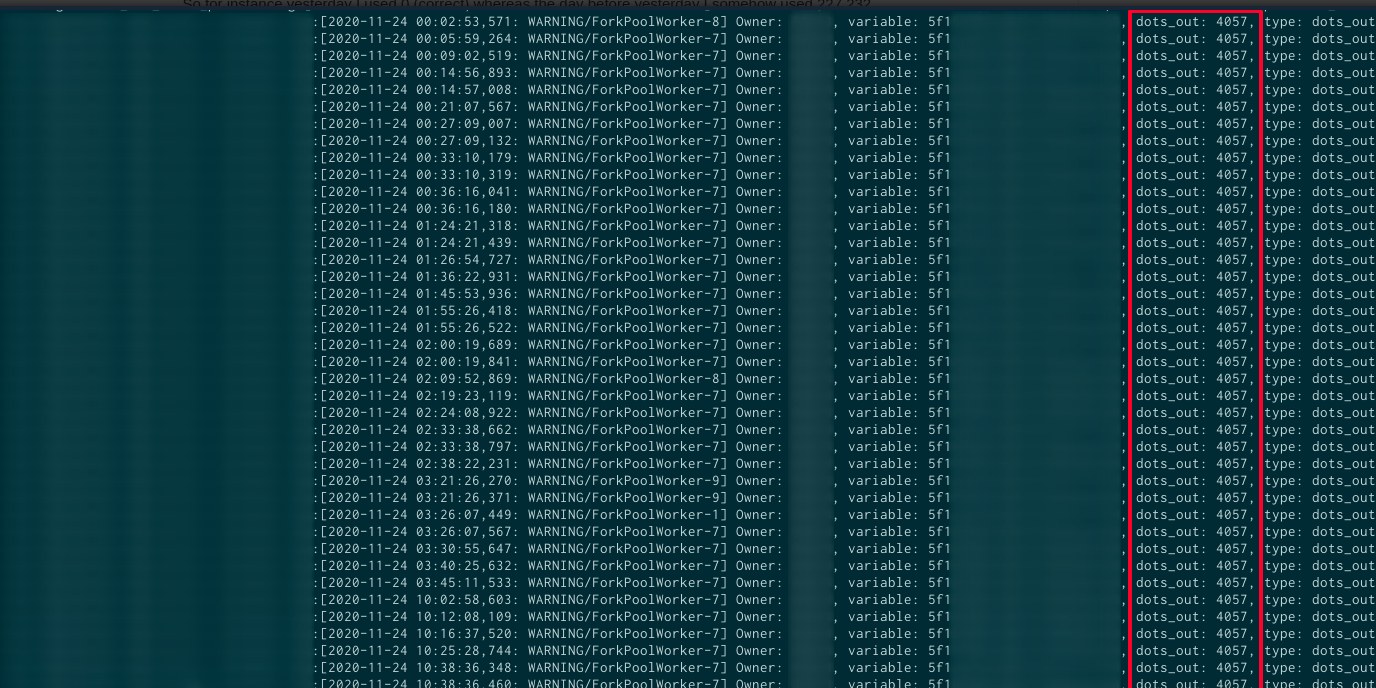
Greetings, we have looked into your logs and the dashboard iSpindel Dashboard is consuming 4057 dots every time that it is charged. We also found that the dashboard is loaded several times during the day, i.e on the November 24th it was loaded more than 75 times, because of this, your dots consumption is reaching the limits every day. My advice to you is that you change your default time span to just a couple of days or hours, in that way, your dots out limits will not be reached so quickly.