5 Industrial IoT Applications With Real Examples (2026)
From quality control to energy efficiency and remote services, discover the five Industrial IoT applications driving real results in 2026, with concrete examples, technologies, and measurable business impact.

Key Takeaways
- Most real Industrial IoT deployments in 2026 cluster into five dominant application categories—monitoring critical variables, OEE tracking, environmental compliance, resource efficiency, and remote asset monitoring.
- Each application is illustrated with concrete 2024–2026 scenarios, including typical sensors, communication protocols, and measurable business outcomes.
- Successful IIoT projects start small and focused, then expand once value is proven—big bang transformations rarely work.
- Companies investing in IIoT now build long-term operational leverage through accumulated data, refined algorithms, and new service-based business models.
What Is Industrial Internet of Things (IIoT) in 2026?
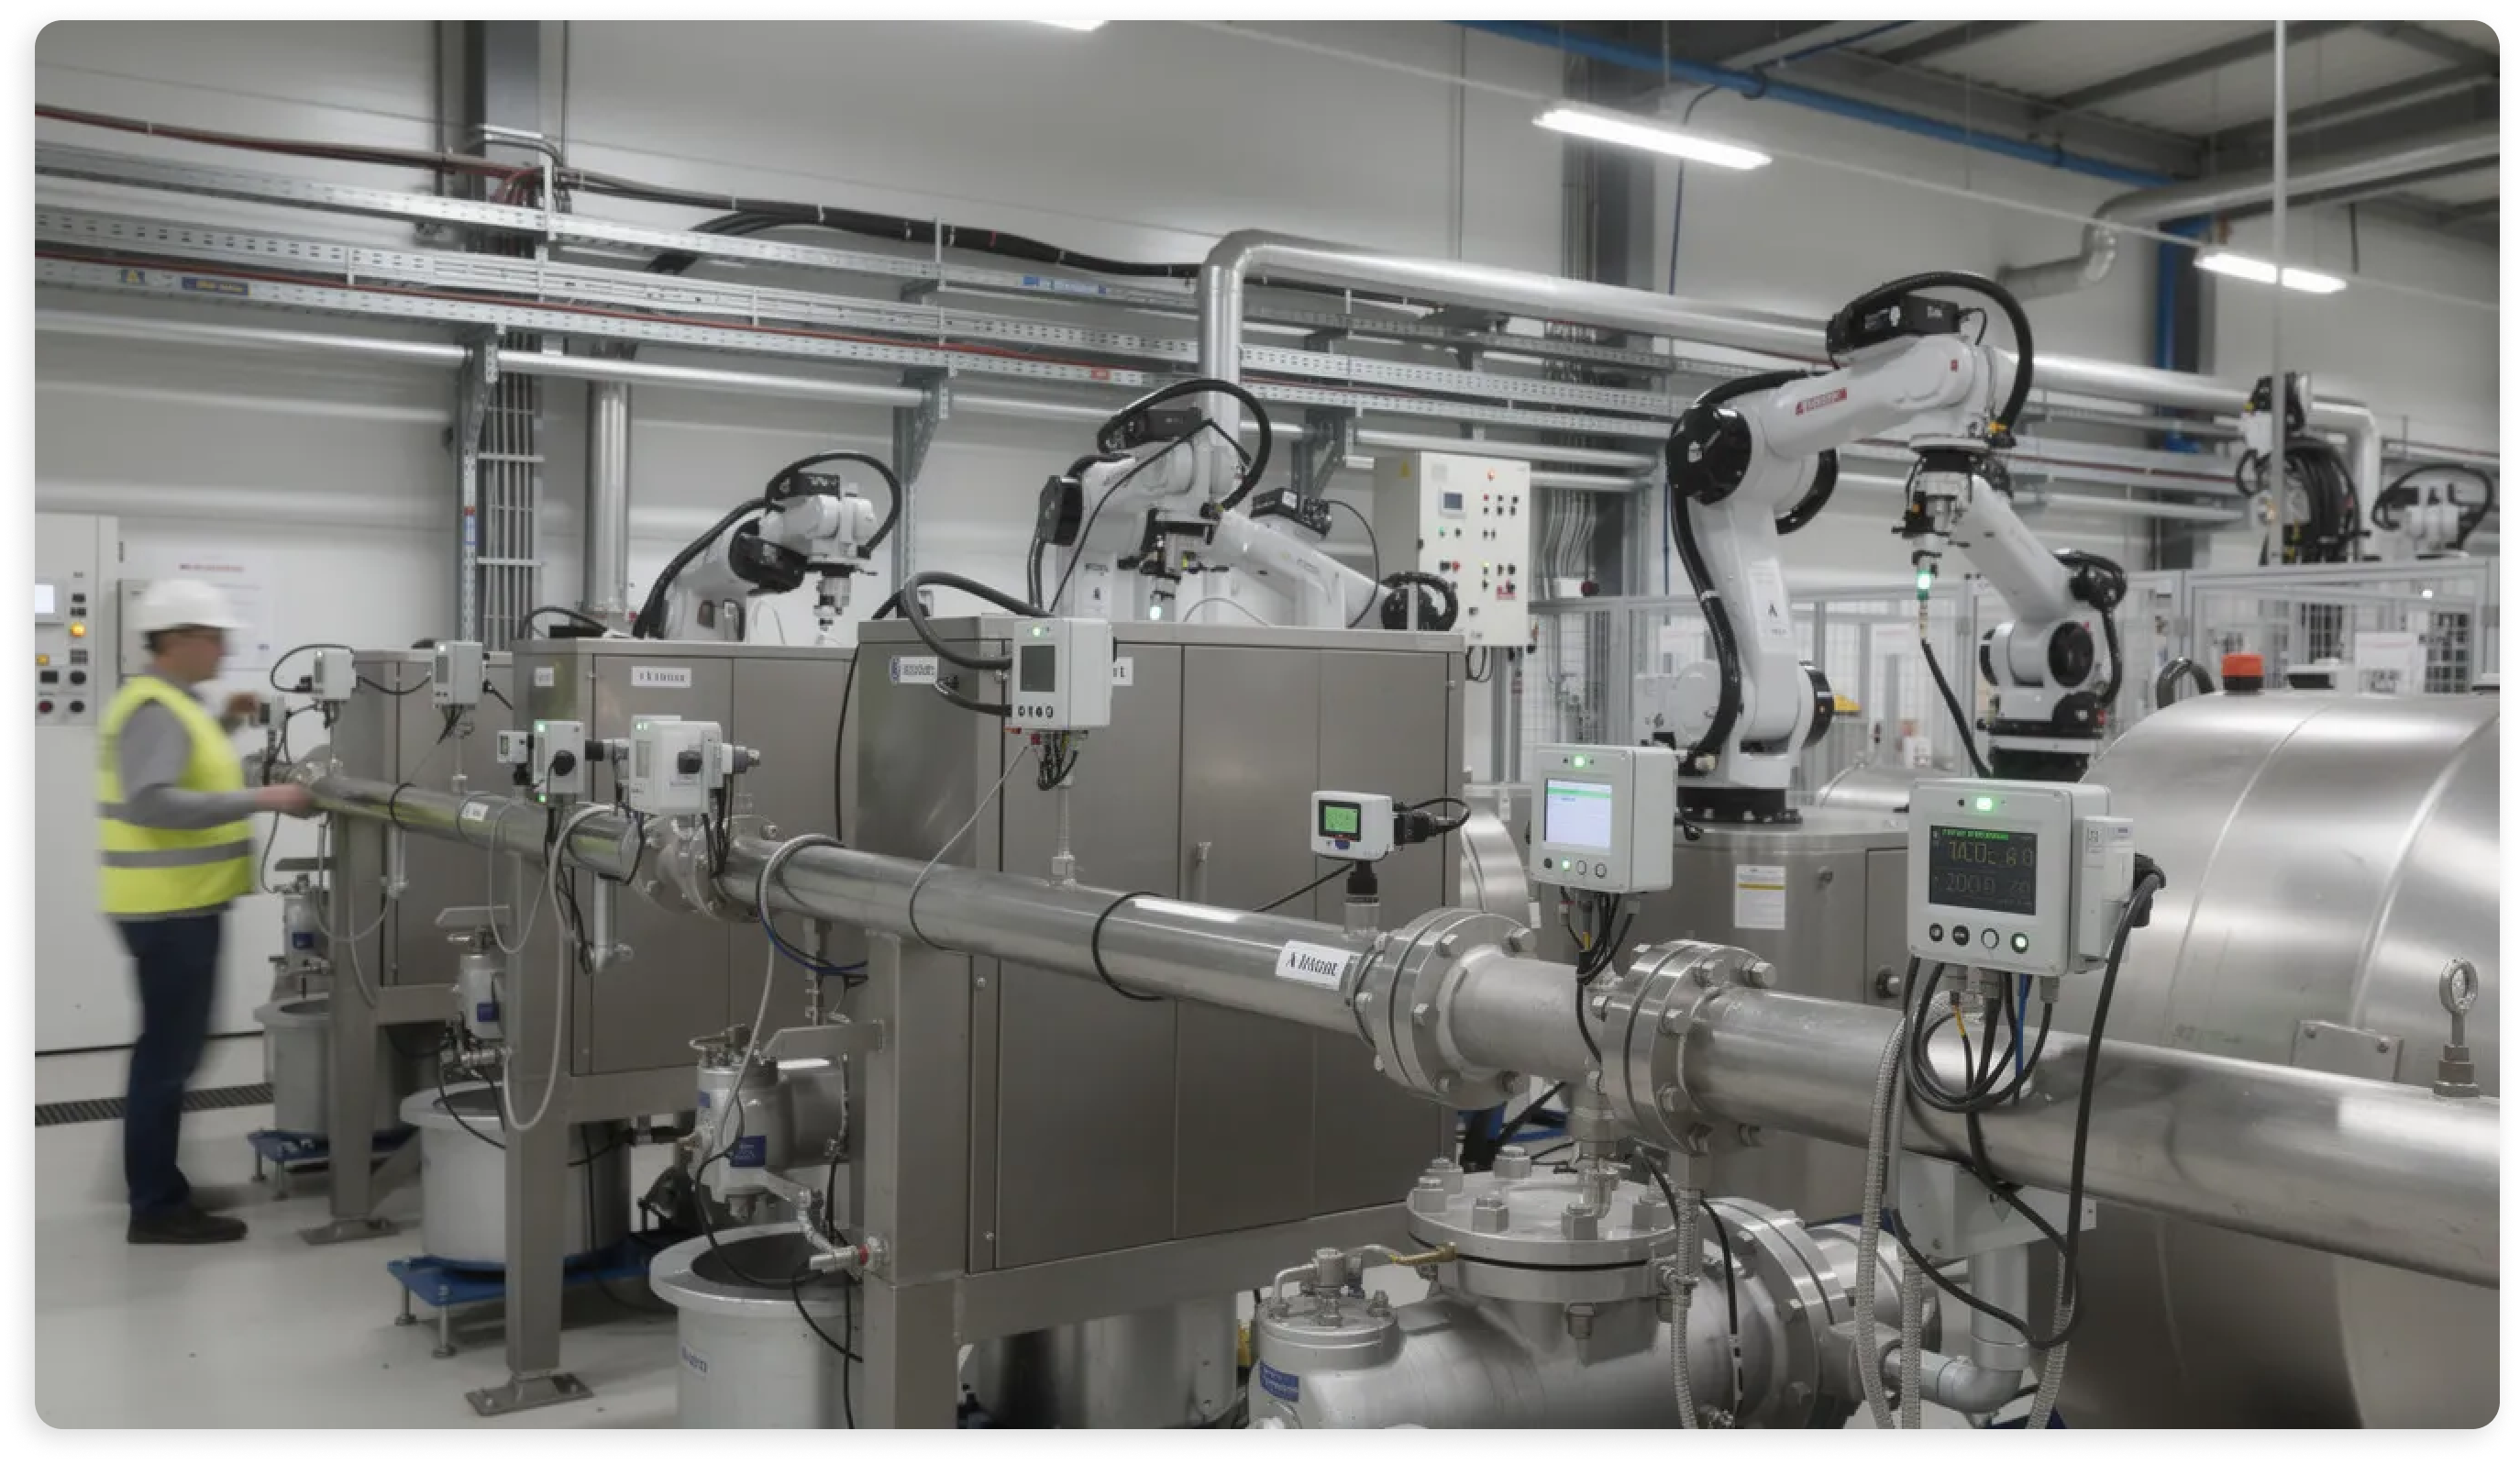
Industrial IoT is the networking of industrial assets—machines, production lines, utilities, vehicles, and field equipment—via sensors, PLCs, and gateways to collect and act on operational data. This is not about consumer gadgets or smart home devices. The Industrial Internet of Things focuses on demanding environments where connected devices must withstand extreme temperatures, moisture, vibration, and continuous operation.
In 2026, typical IIoT deployments follow a layered architecture:
- Field layer: Sensors and PLCs gather data from physical objects using industrial communication protocols like Modbus, PROFINET, or OPC UA.
- Edge layer: Industrial gateways handle data acquisition, protocol conversion, and local data processing before transmission.
- Network layer: Ethernet/IP, 4G/5G cellular, or LoRaWAN provide connectivity.
- Analytics layer: On-premises servers or cloud computing platforms store and analyze data. Lately, this layer has been increasingly aided by artificial intelligence.
Most successful projects in 2026 still start small—one production line, one utility system, one asset class—and expand once value is proven. Trying to instrument an entire organization on day one rarely works.
This article covers the five dominant application patterns where manufacturing companies, utilities, and infrastructure operators are actually deploying IIoT technology today.
The Five Dominant Industrial IoT Application Patterns
Based on how factories and industrial operators actually adopt digital technology—not marketing frameworks—most industrial IoT applications in 2026 fall into five categories:
- Monitoring critical production variables – continuous visibility into physical or chemical variables, often instrumented in PLCs, that are critical for the final product.
- OEE and runtime/downtime monitoring – capturing availability, performance, and quality metrics for machines and lines to drive uptime and throughput.
- Environmental monitoring and compliance – tracking temperature, humidity, air quality, noise, and other EHS/compliance indicators with real time data.
- Resource efficiency (energy, water, gas, compressed air) – measuring and optimizing utilities and media that drive operating costs.
- Equipment-as-a-Service and remote asset monitoring – enabling OEMs and service providers to remotely monitor assets deployed at customer sites.
Each section below deep-dives into one category with a real-world example, typical technologies, and business results.
1. Monitoring Critical Production Variables
Most plants in 2026 still start their IIoT journey with visibility into physical or chemical variables that directly affect product quality. These aren’t cycle times or line speeds—those fall into OEE territory. Instead, this category covers parameters like tank pressure, oven temperature, chemical concentrations, flow rates, and humidity levels that must stay within tight tolerances.
Consider a storage chamber in a yogurt factory that must maintain a precise temperature range. A two-degree excursion for just an hour could spoil an entire batch worth tens of thousands of dollars. Or a pharmaceutical mixing tank where pressure drops could indicate seal failures, contaminating a $200,000 batch of active ingredients. These aren’t hypothetical scenarios—they represent the daily reality that drives data collection investments.
Why this matters operationally:
- Faster detection of process deviations before they become quality failures.
- Objective sensor data replaces manual spot-checks and paper logs.
- Long-term data storage supports root-cause analysis during customer complaints.
- Reduces scrap and rework costs with early intervention.
Typical data sources and technologies:
Component | Common Options |
|---|---|
Sensors | Pressure transducers, RTD/thermocouple temperature sensors, pH probes, flow meters |
Signal types | 4–20 mA analog, digital I/O, serial RS-485 |
PLC integration | OPC UA or Modbus/TCP for data acquisition |
Edge gateway | Protocol conversion, local buffering, MQTT or HTTPS publishing |
Business outcomes from these deployments are concrete. Plants typically report 15–25% reductions in process-related scrap within the first year, plus significantly faster troubleshooting when quality issues arise. The ability to pull up historical data and pinpoint exactly when a variable drifted out of spec transforms quality investigations from guesswork into precise analysis.
Real-World Example: Corona Ceramics (Latin America)
Corona, a leading ceramics manufacturer in Latin America, must maintain precise oven temperatures throughout their firing process. Ceramic products require carefully controlled heating profiles—if kiln temperatures deviate even slightly from setpoints, the entire batch can develop cracks, warping, or structural weaknesses that only become apparent after cooling.
Before deploying IIoT sensors, operators relied on periodic manual checks and legacy temperature controllers with limited logging capability. When quality issues emerged, pinpointing whether a temperature excursion occurred—and when—was nearly impossible.
Their IIoT deployment now continuously monitors kiln temperatures across multiple zones, with IIoT data streaming to dashboards that maintenance and quality teams access in real time. When temperatures begin drifting toward threshold limits, alerts trigger before product damage occurs. The system also archives complete thermal profiles for every batch, providing valuable insights during quality audits and enabling process optimization over time.
2. OEE and Runtime/Downtime Monitoring
Overall Equipment Effectiveness combines three factors: Availability (was the machine running?), Performance (was it running at target speed?), and Quality (did it produce good parts?). In practice, many plants in 2026 focus first on simply capturing runtime versus downtime before tackling full OEE analytics. Getting accurate downtime data—and more importantly, downtime reason codes—is often the real challenge.
Operational pain points addressed:
- Unplanned equipment downtime that disrupts schedules and costs money.
- Unclear causes of micro-stops that accumulate into significant losses.
- Differences between shifts that are hard to compare without data.
- Debates about machine performance that lack objective evidence.
Signals are typically collected from digital inputs (stack lights, PLC run/stop bits), manual operator inputs for downtime reasons, and barcode or RFID scans for product changeovers. The raw data flows through edge gateways that perform local aggregation and calculation before sending summaries to central computer systems for analysis and visualization.
Specific business results include measured reductions in unplanned production downtime (often 20–40 minutes per shift once issues become visible), improved OEE percentages on bottleneck machines, and better planning for changeover activities.
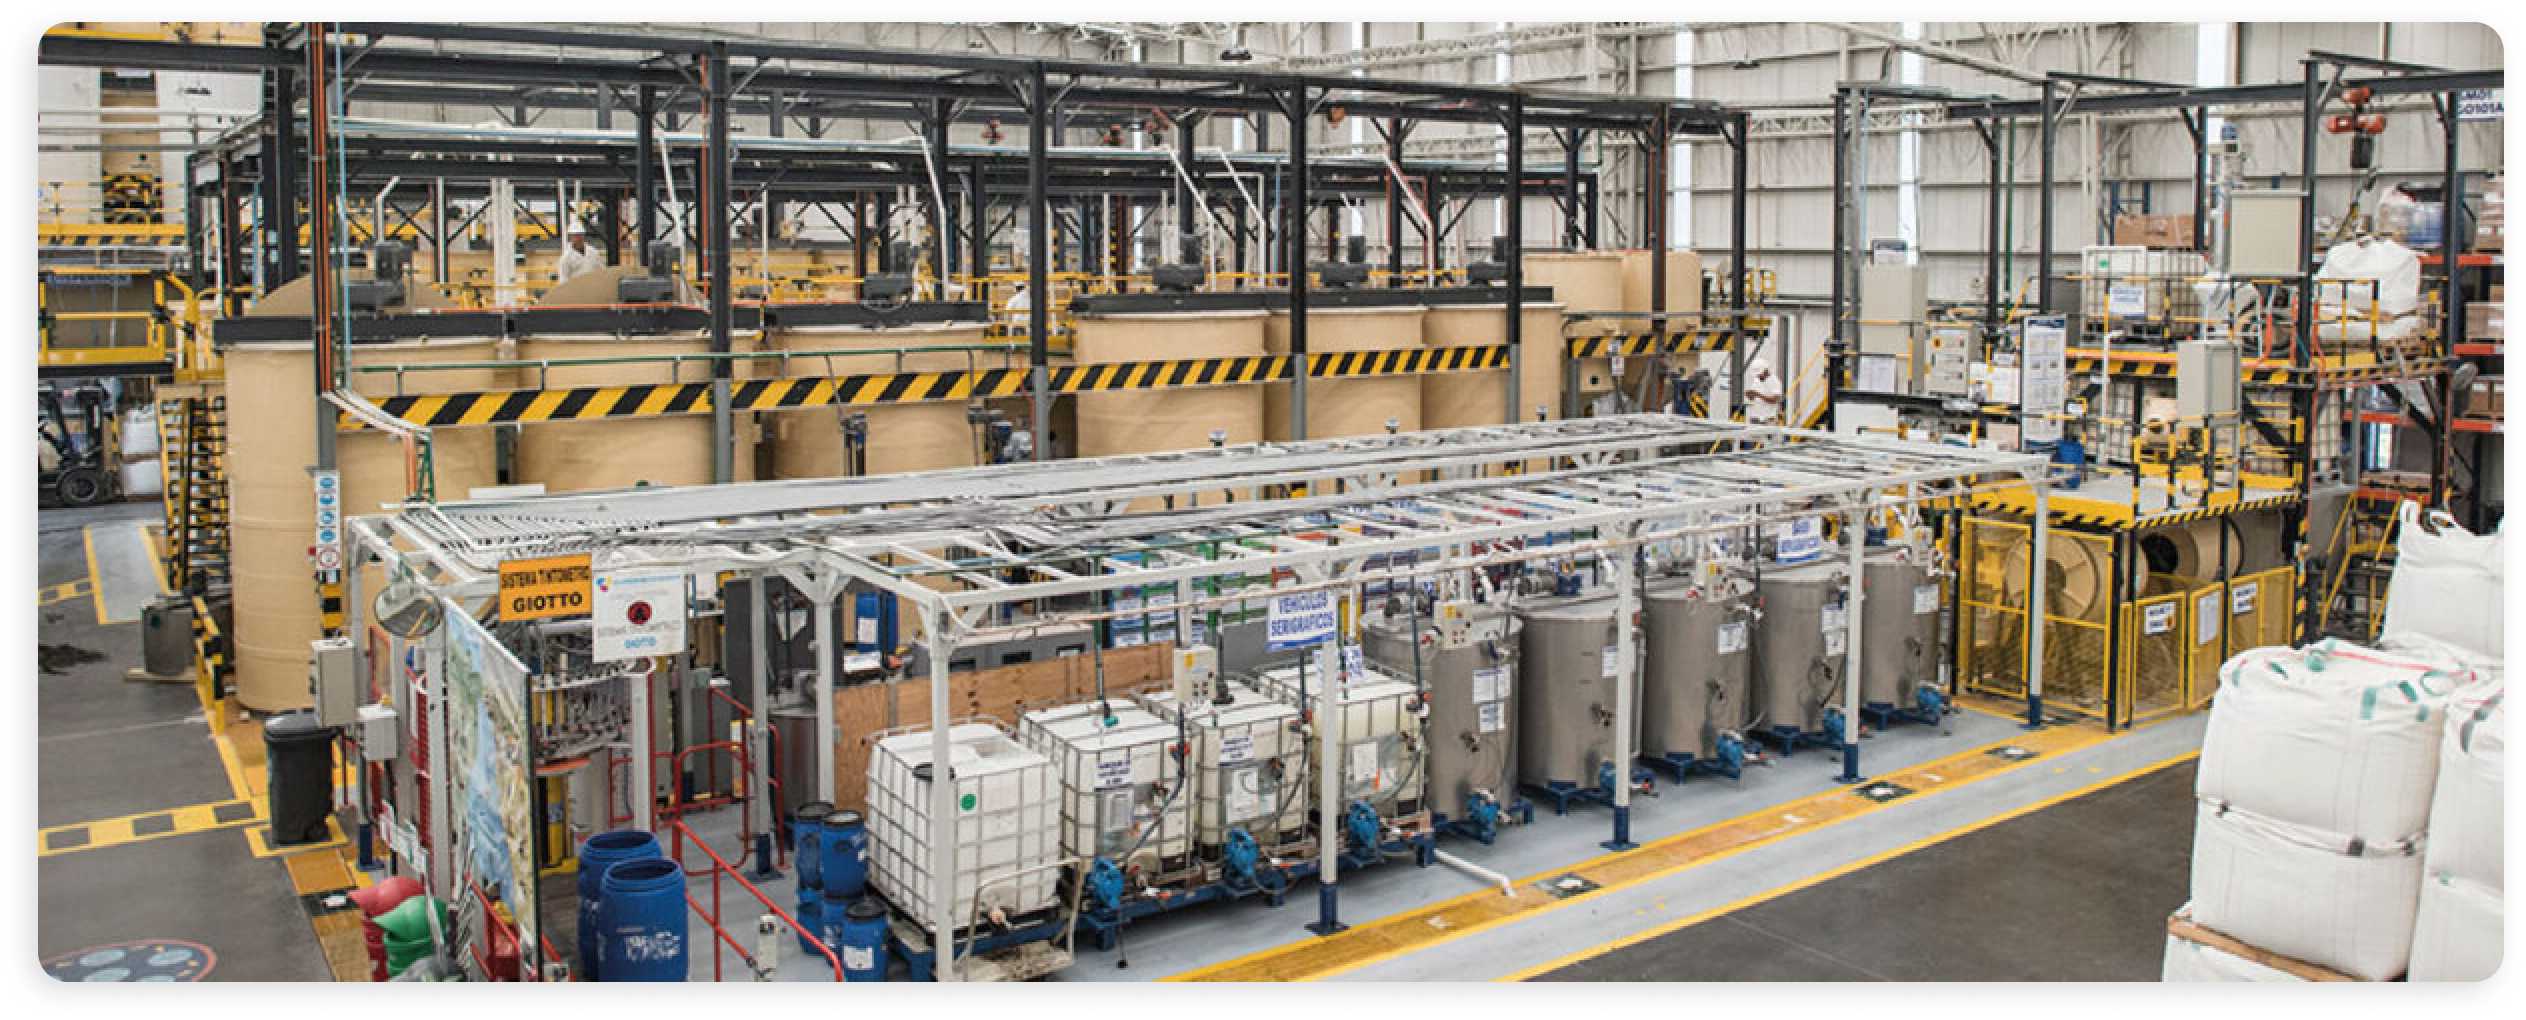
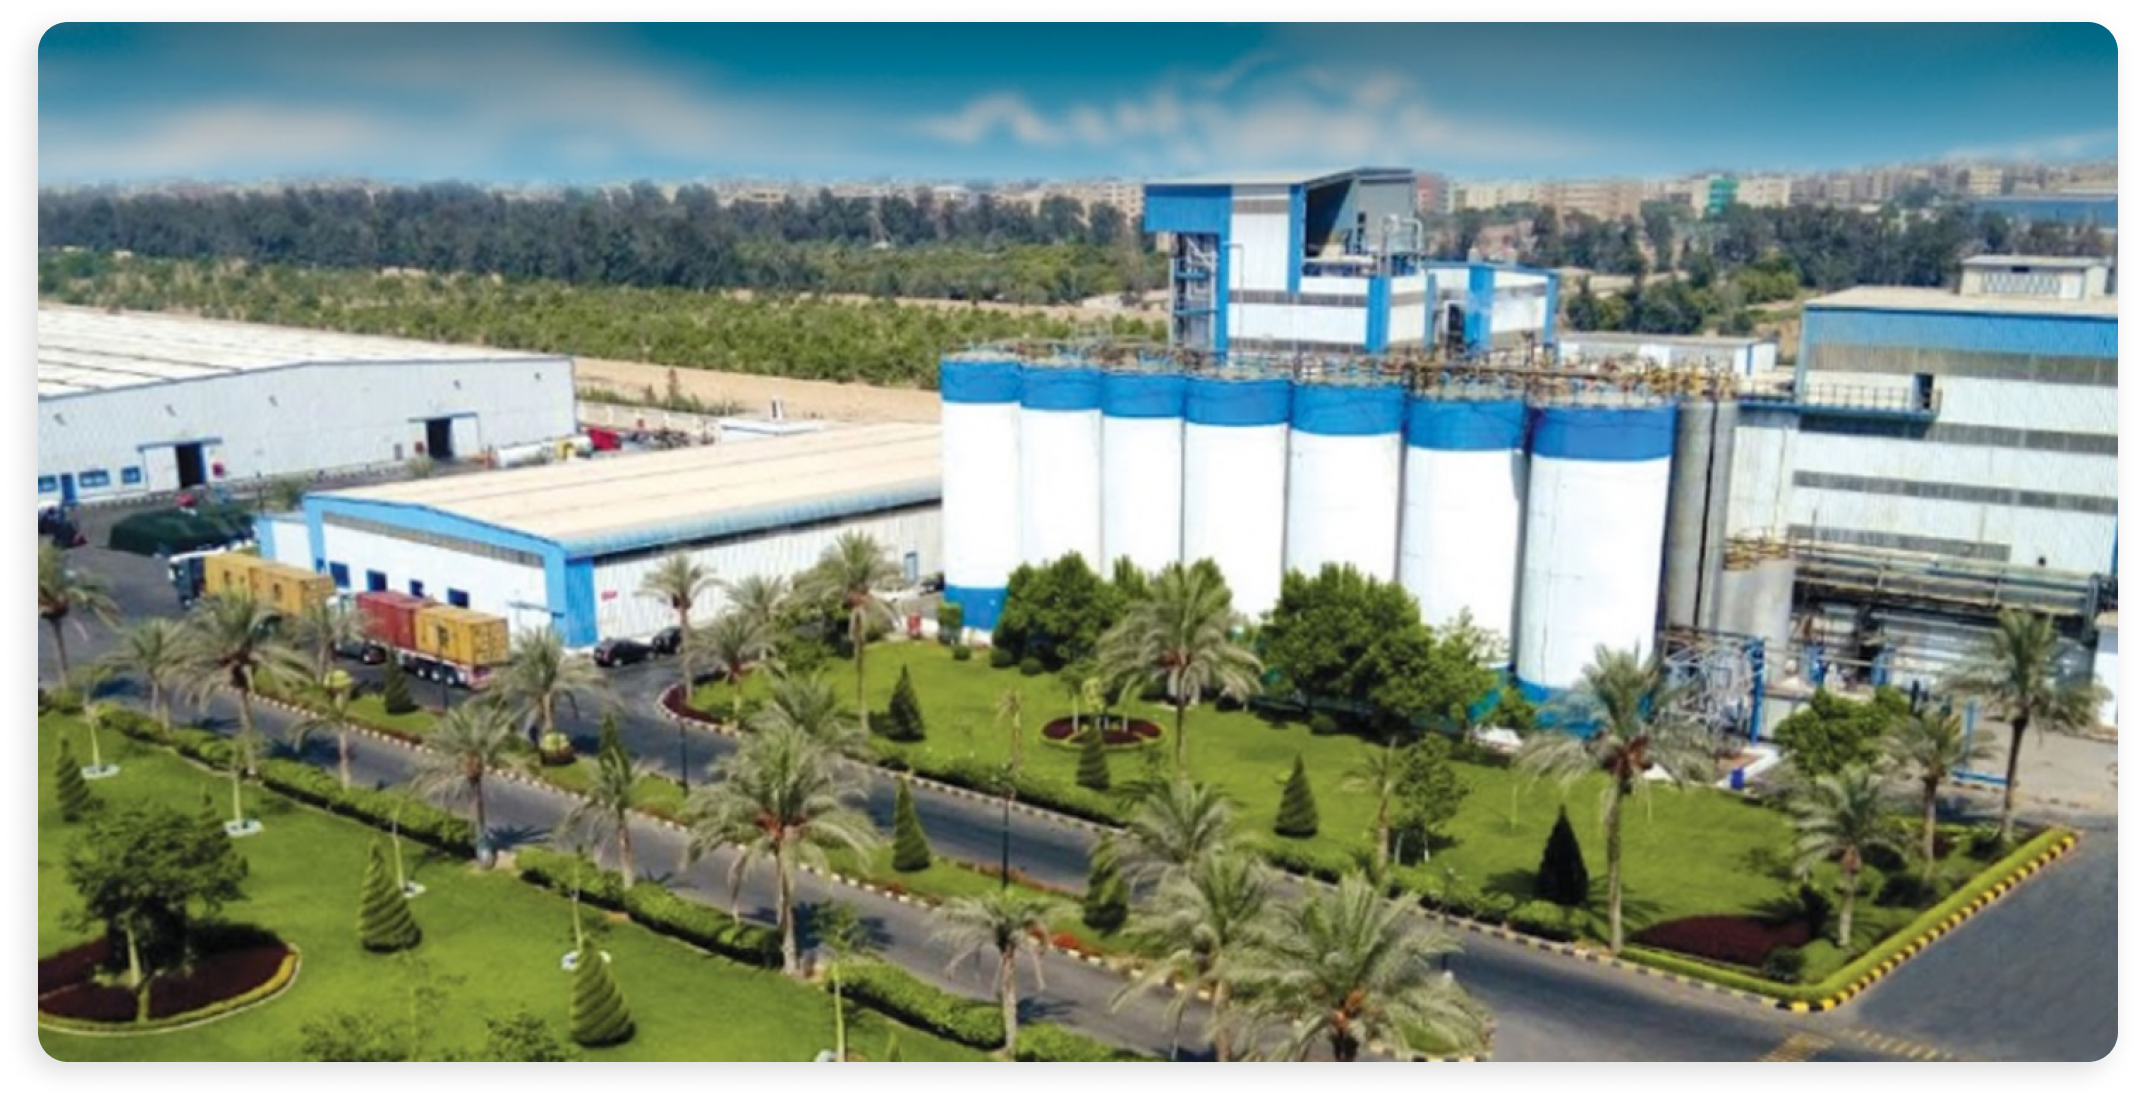
Real-World Example: Arma Soap and Chemicals
Arma, a soap and chemical manufacturer in Egypt, deployed an IIoT system for OEE monitoring across their production lines. Before implementation, shift supervisors relied on handwritten logs and end-of-day summaries to track machine performance—data that was often incomplete, delayed, and difficult to analyze effectively.
The new system captures machine states automatically, categorizes downtime events, and presents real time insights on shop floor dashboards. Operators now log downtime reasons on touchscreens, creating a dataset that enables weekly “top 10 losses” reviews. Within months of deployment, the plant identified specific recurring issues—a packaging machine jam that happened predictably after certain product changeovers, a filling line that consistently underperformed during the first hour of each shift.
By making these patterns visible, Arma’s operations team could target improvement efforts where they would have the biggest impact, driving measurable gains in throughput without adding new equipment.
3. Environmental Monitoring and Compliance
Environmental and EHS monitoring has matured quickly, driven by regulatory pressure and corporate sustainability targets. This category extends beyond production variables to facility-wide conditions that affect safety, compliance, and product integrity.
Parameters typically monitored:
- Ambient temperature and humidity in storage and production areas
- Differential pressure in cleanrooms and controlled environments
- VOCs, particulate matter, and other air quality indicators
- Noise levels for worker safety compliance
- Wastewater quality parameters (pH, turbidity, chemical concentrations)
This matters operationally because regulatory agencies—FDA, EPA, OSHA, and local environmental bodies—require documented proof of compliance. Manual logging is error-prone and labor-intensive. IIoT environmental monitoring creates automated audit trails, immediate excursion alerts, and historical records that satisfy regulators and customers alike.
In Canada, for example, wastewater discharge pH must remain within specific thresholds. Manufacturing facilities that discharge to municipal systems face penalties if their effluent falls outside permitted ranges. IoT-connected pH sensors monitor discharge continuously, alerting operators before violations occur and creating timestamped records that demonstrate compliance.
Typical sensors for environmental monitoring:
Application | Sensor Types |
|---|---|
Water quality | pH probes, conductivity sensors, turbidity meters, dissolved oxygen |
Air quality | CO₂, VOC, particulate matter sensors |
Weather/outdoor | Temperature, humidity, wind speed, precipitation |
Gas detection | Combustible gas sensors, toxic gas monitors |
Benefits include reduced regulatory penalties, faster response to equipment failures, and simplified documentation for audits and customer requirements.
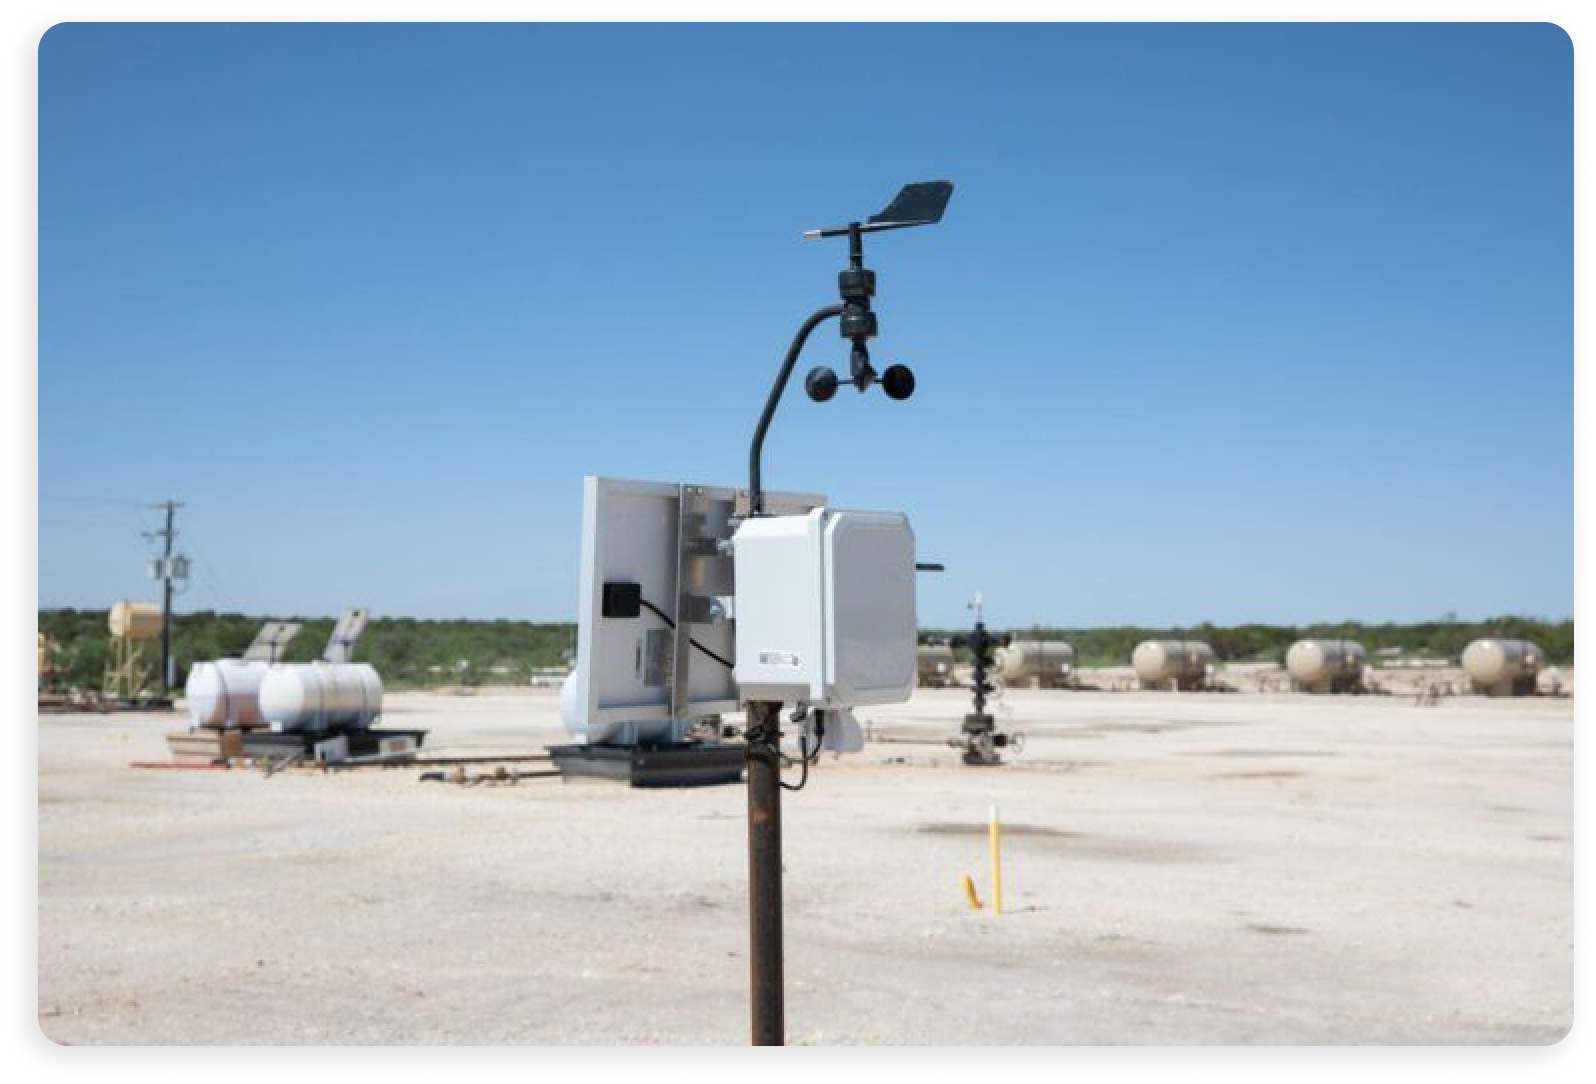
Real-World Example: QubeIoT Emissions Monitoring
QubeIoT provides emissions monitoring solutions that help industrial facilities track and report air quality data for regulatory compliance. Their systems deploy sensor networks that continuously monitor stack emissions, fugitive emissions, and ambient air quality at facility boundaries.
Rather than relying on periodic manual sampling—which captures only snapshots and may miss intermittent emissions events—QubeIoT’s connected devices provide continuous data streams. This approach supports extracting meaningful insights about emission patterns, identifying sources of elevated readings, and demonstrating ongoing compliance to regulators.
For facilities subject to air quality permits, this continuous monitoring approach transforms compliance from a periodic audit exercise into an ongoing operational capability. The data generated also supports corporate ESG reporting, providing the documented metrics that stakeholders increasingly demand.
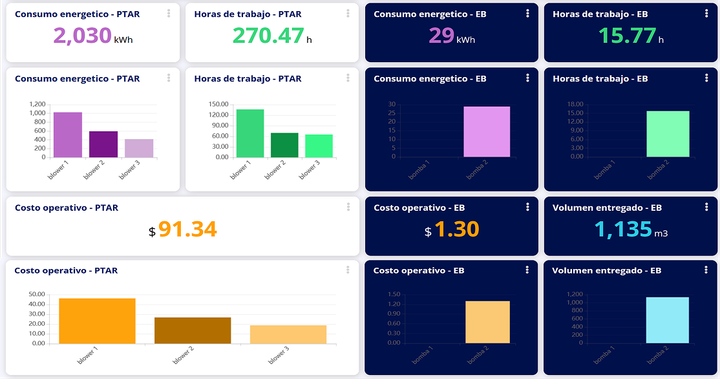
4. Resource Efficiency: Energy, Water, Gas, and Compressed Air
Rising energy prices, carbon pricing schemes, and corporate sustainability goals have made resource efficiency one of the fastest-growing IIoT application areas in 2024–2026. According to industry reports, energy consumption now represents an increasingly significant portion of manufacturing costs—automotive plants in Germany, for instance, have seen energy costs rise substantially over the past several years, making efficiency improvements directly impact-profitable.
These projects focus on metering and sub-metering: electricity by line or machine, natural gas for ovens and boilers, compressed air branch lines, and water usage by process or building zone. The goal is granular visibility that enables action.
Typical sensors and data sources:
Resource | Measurement Approach |
|---|---|
Electricity | Clamp-on power meters, CT-based submeters, pulse outputs |
Natural gas | Pulse counters on utility meters, M-Bus integration |
Compressed air | Flow meters on branch lines, pressure sensors |
Water | Electromagnetic flow meters, pulse output meters |
Steam | Differential pressure flow measurement, temperature sensors |
Common protocols include Modbus RTU/TCP on energy meters, M-Bus for utility meters, and industrial gateways that aggregate data for analysis. Edge computing handles local calculations and anomaly detection, reducing sufficient bandwidth capacity requirements by sending summaries rather than raw data streams.
Operational decisions enabled:
- Identifying “energy hog” machines that consume disproportionate resources
- Detecting leaks in compressed air networks (a common source of waste)
- Scheduling high-energy processes during off-peak tariff periods
- Validating savings from improvement projects with before/after comparisons
Realistic outcomes include 5–15% energy cost reduction in the first 1–2 years, with payback periods for meters, gateways, and integration work typically under 24 months.
Real-World Example: Quantify Environmental – Small Changes, Big Impacts
Quantify Environmental partnered with Carlsberg Group Canada on a water efficiency project that earned the 2025 Water Efficiency Excellence Award from Waterloo Region Council. Working through the Region’s WET (Water Efficient Technology) Program, Carlsberg installed smart sub-meters throughout its Kitchener production facility in 2024.
The IIoT deployment gave Carlsberg real time data needed to identify inefficiencies across their brewing and bottling operations. By analyzing energy usage patterns and water consumption at a granular level, the team pinpointed specific processes and equipment where water was being wasted—information that was invisible with only building-level utility meters.
The results were substantial: a 100,000 m³ annual reduction in water use. To put that in perspective, that’s enough water to supply over 450 homes for a full year or fill more than 11 million cases of beer. This project demonstrates how data-driven sustainability delivers measurable business impact, not just environmental benefits.
5. Equipment-as-a-Service and Remote Asset Monitoring
Many OEMs and service providers now use IIoT to remotely monitor fleets of machines, skid-mounted systems, pumps, compressors, and other assets deployed at customer sites. This represents a fundamental shift from the traditional “ship and forget” model.
With connectivity embedded in equipment, OEMs receive continuous status, utilization, and health data from assets operating across hundreds of customer locations. This enables new business models:
- Uptime guarantees: Performance-based contracts where the OEM takes responsibility for availability
- Pay-per-use pricing: Customers pay based on actual utilization rather than purchasing equipment outright
- Predictive maintenance: Service visits scheduled based on actual equipment condition, not fixed calendars
- Proactive support: Identifying problems before customers even notice them
Typical data points collected:
Category | Examples |
|---|---|
Utilization | Run hours, on/off cycles, load profiles |
Health indicators | Vibration levels, bearing temperatures, motor current |
Performance | Output pressure/flow, efficiency metrics |
Events | Error codes, alarm history, maintenance actions |
Connectivity constraints are real in these deployments. Customer firewalls, IT policies, and remote locations all create challenges. Solutions include private APNs, VPN tunnels, cellular gateways with local buffering, and protocols like MQTT that handle intermittent connectivity gracefully. Secure IIoT deployments require careful attention to network segmentation, device authentication, and data ownership agreements.
Real-World Example: DESMI Marine Pump Monitoring (2022–2026)
DESMI, a global manufacturer of marine pumps and related equipment, has deployed IoT connectivity to monitor their pumps remotely across vessels and installations worldwide. Traditionally, pump maintenance was calendar-based—technicians would service equipment on fixed schedules regardless of actual condition.
With their IIoT system, DESMI now receives continuous telemetry from pumps operating on ships and at customer sites. Data points include operating hours, vibration signatures, motor temperatures, and performance metrics. This IIoT system enables predictive analytics—identifying pumps that show early signs of bearing wear or seal degradation before catastrophic failure occurs.
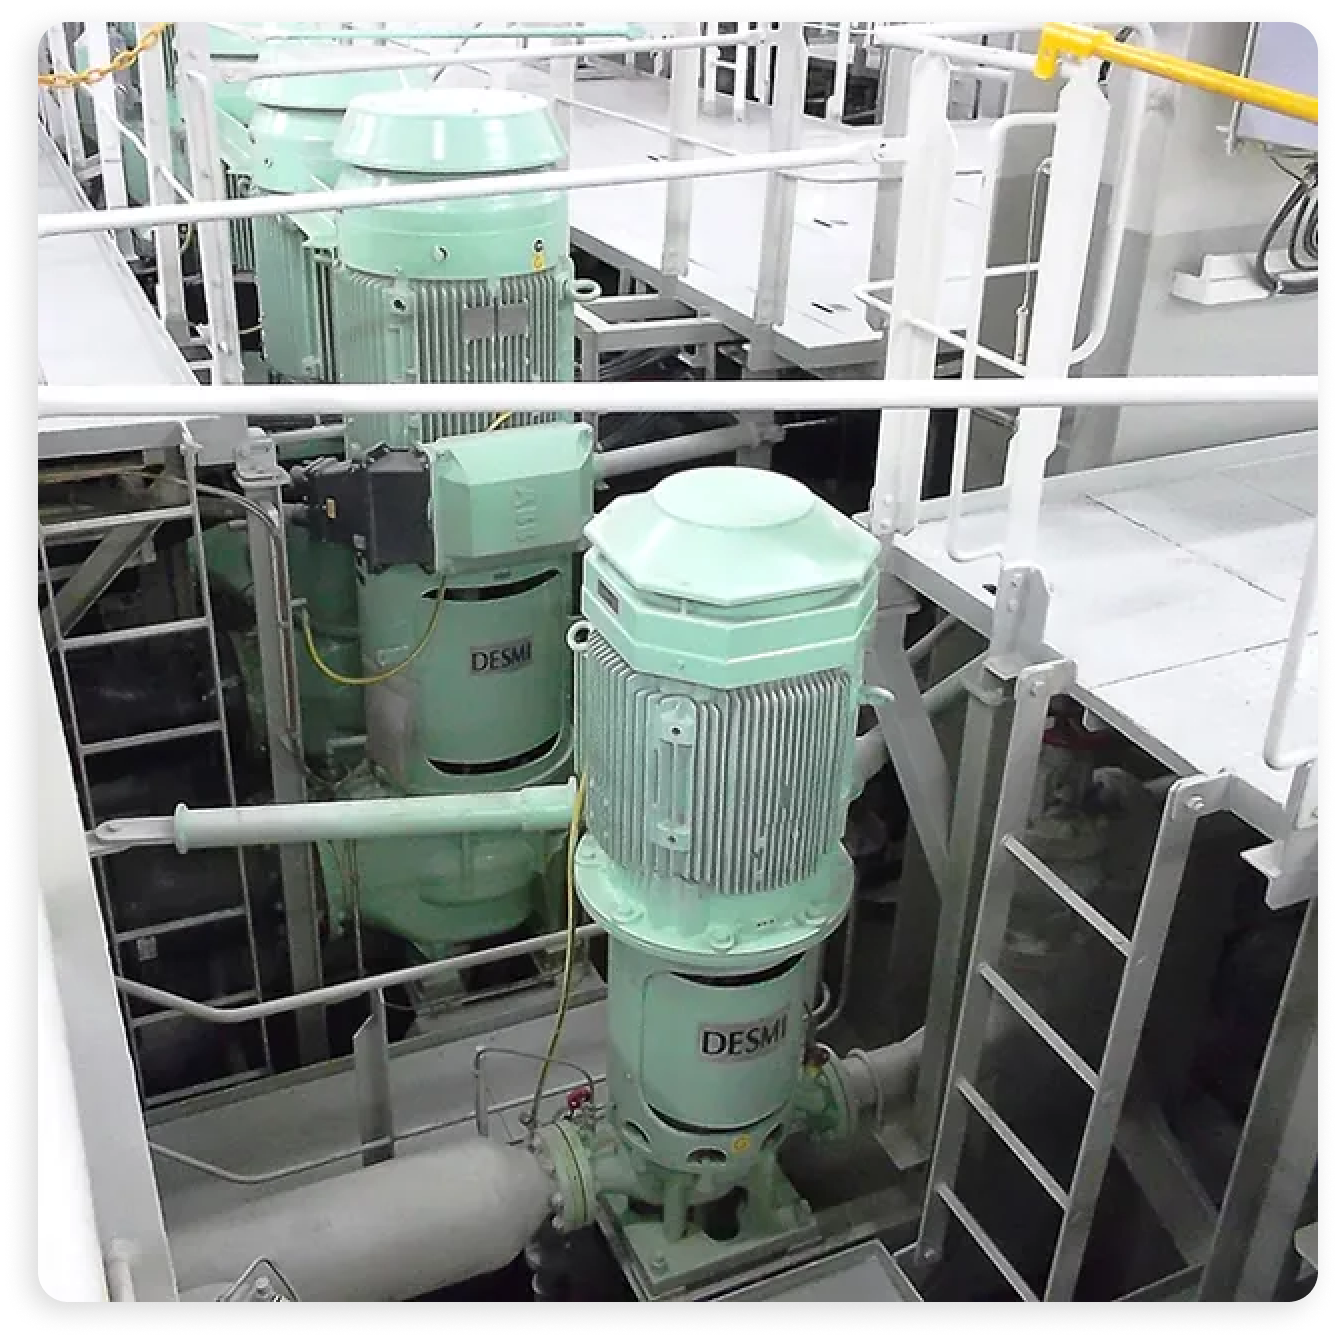
For customers, this means higher equipment availability and fewer unexpected breakdowns at sea, where emergency repairs are extremely costly. For DESMI, it creates new recurring revenue streams through service contracts, improves customer satisfaction through proactive support, and provides product development insights based on real-world operating data from their entire organization’s installed base.
IIoT Technology Building Blocks Behind These Use Cases
All five application categories share common underlying technologies. Understanding these building blocks helps when planning industrial IoT systems.
Field-layer components:
- IIoT devices and sensors for temperature, vibration, flow, pressure, and power measurement
- Legacy signals (4–20 mA analog, digital I/O) that already exist in most plants
- PLCs and industrial controllers that can exchange data via standard protocols
Connectivity options:
Environment | Common Technologies |
|---|---|
Wired industrial | EtherNet/IP, PROFINET, Modbus TCP |
Serial legacy | Modbus RTU over RS-485, serial-to-Ethernet converters |
Wireless on-site | LoRaWAN, BLE, proprietary sub-GHz |
Remote/mobile | 4G/5G cellular, satellite for extreme locations |
Edge gateways serve as the bridge between field IoT devices and central systems. They handle protocol conversion (e.g., Modbus to MQTT), local buffering during network outages, simple analytics like threshold monitoring and aggregation, and secure tunneling to cloud storage or on-premises servers.
Data and analytics layers typically include time-series databases optimized for sensor data, rules engines for alerts and notifications, dashboards for operations teams, and machine learning algorithms for anomaly detection once sufficient data history is available. Big data analytics capabilities become increasingly important as data generated accumulates over months and years.
Cybersecurity practices common across use cases include network segmentation between IT and OT networks, device authentication and access control, encryption for data in transit, regular firmware patching, and monitoring for data breaches or unauthorized access. An integrated security solution approach is essential—cyber physical systems require protection at every layer.
From Monitoring to Optimization to Service Models: Going Into The IIoT-Led Fourth Industrial Revolution
The five application categories are converging in practice. Plants often start with basic monitoring and OEE tracking, extend to energy management and environmental compliance, and eventually support remote service and new business models.
As datasets mature—typically 12–36 months of historical data—organizations move from reactive dashboards to process optimization:
- Predictive maintenance models that forecast failures before they occur
- Schedule optimization that accounts for energy costs, equipment condition, and demand
- Automated setpoint tuning that maintains optimal operating conditions with minimal human intervention
The same data foundation that supports internal optimization can later be used externally. Manufacturers share performance benchmarks with suppliers. Asset utilization data feeds into service contracts. Operational transparency becomes a competitive advantage.
Companies investing in IIoT now are building long-term operational leverage: faster learning cycles, more accurate cost baselines, and the ability to adapt quickly to new regulatory, cost, or demand pressures.
This is the fourth industrial revolution in practice—not a single transformative event, but a steady accumulation of connected devices, relevant data, and analytical capabilities that compound over time. Organizations that accelerate digital transformation through focused IIoT projects today gain advantages that are increasingly difficult for competitors to replicate.
The smart manufacturing and smart factories concepts become real through incremental deployment, not grand visions. Pick one or two of the five application categories that align with your most pressing current problems. Pilot them with a clear ROI target. Prove value, then expand.
FAQ: Practical Industrial IoT Questions
How should a plant choose which IIoT use case to start with in 2026?
Start with your biggest, most measurable pain point. If unplanned equipment downtime is costing you production hours every week, OEE monitoring makes sense. If rising energy costs are squeezing margins, sub-metering provides immediate visibility. If compliance documentation consumes significant staff time, environmental monitoring automates that burden. The first project should be scoped to execute in 3–6 months with clear, quantifiable success criteria. Avoid trying to address business processes across your entire business simultaneously.
What skills and teams are typically needed to deliver a successful IIoT project?
Successful deployments require a cross-functional team. You need OT/maintenance staff who understand the equipment, controls/automation engineers who can interface with PLCs and sensors, IT or networking specialists who handle connectivity and security, and—critically—an operations champion who owns the business outcome. Technology deployed without operational ownership becomes shelfware. Radio frequency identification and asset tracking projects additionally benefit from logistics expertise.
How do companies justify IIoT investments to management?
Frame the business case in terms leadership understands: reduced downtime hours (converted to production value), scrap and rework reduction, avoided product loss, or energy savings. Use conservative assumptions and show a clear payback period. For a monitoring project, calculate: cost of one prevented failure or quality incident × probability of occurrence × time period. Compare against sensor, gateway, and integration costs. Most well-scoped projects show 12–24 month payback, which resonates with operations budgets.
Can IIoT be deployed on older legacy equipment without modern PLCs?
Absolutely—and this is often where IIoT brings the highest marginal benefit. Modern equipment may already have built-in connectivity, but legacy machines are data blind spots. Retrofit approaches include clamp-on power meters (non-invasive installation), vibration sensors mounted externally, digital I/O taps on indicator lights or relays, and serial protocol converters for older controllers. Edge gateways with Modbus or similar support can pull data from equipment dating back decades. Data centers and critical infrastructure often run equipment far older than typical IT assets.
How long does it typically take to see value from an IIoT deployment?
Initial insights often appear within weeks once data flows—you may immediately spot anomalies or patterns that were previously invisible. Measurable operational improvements (reduced downtime, lower scrap, energy savings) typically emerge within one or two quarters if the project is tightly scoped with clear metrics. Building machine learning models for predictive analytics requires more historical data, usually 6–12 months minimum to establish baseline patterns and validate predictions. The digital transformation journey is ongoing, but early wins should come quickly with focused deployment.