Hi Sebastian. I had a similar problem yesterday but my account limit doesn’t seem to have reset and today I still can’t access data on my device. Could you please have a look at my account and check that the reset hasn’t stalled or perhaps tell me when it is scheduled to reset.
Many thanks
Jon
Hello @Jonlakes ,
I hope that you are well.
I’ve checked your account and the limit did reset, this means that you should be able to view both Dashboards and Devices withouth any issues.
Has this continued to happen?
I’ll be attentive.
Best regards,
Sebastián
Hi Sebastian. Yes it did reset thanks but it seemed to take a couple of days before doing so. To help me avoid hitting the limits again, what’s the easiest way for me to keep an eye on my dot usage?
Thank you for confirming, @Jonlakes , it is a strange behavior that it took a couple of days to reset the limit, I’ll test this from my end to try and reproduce it.
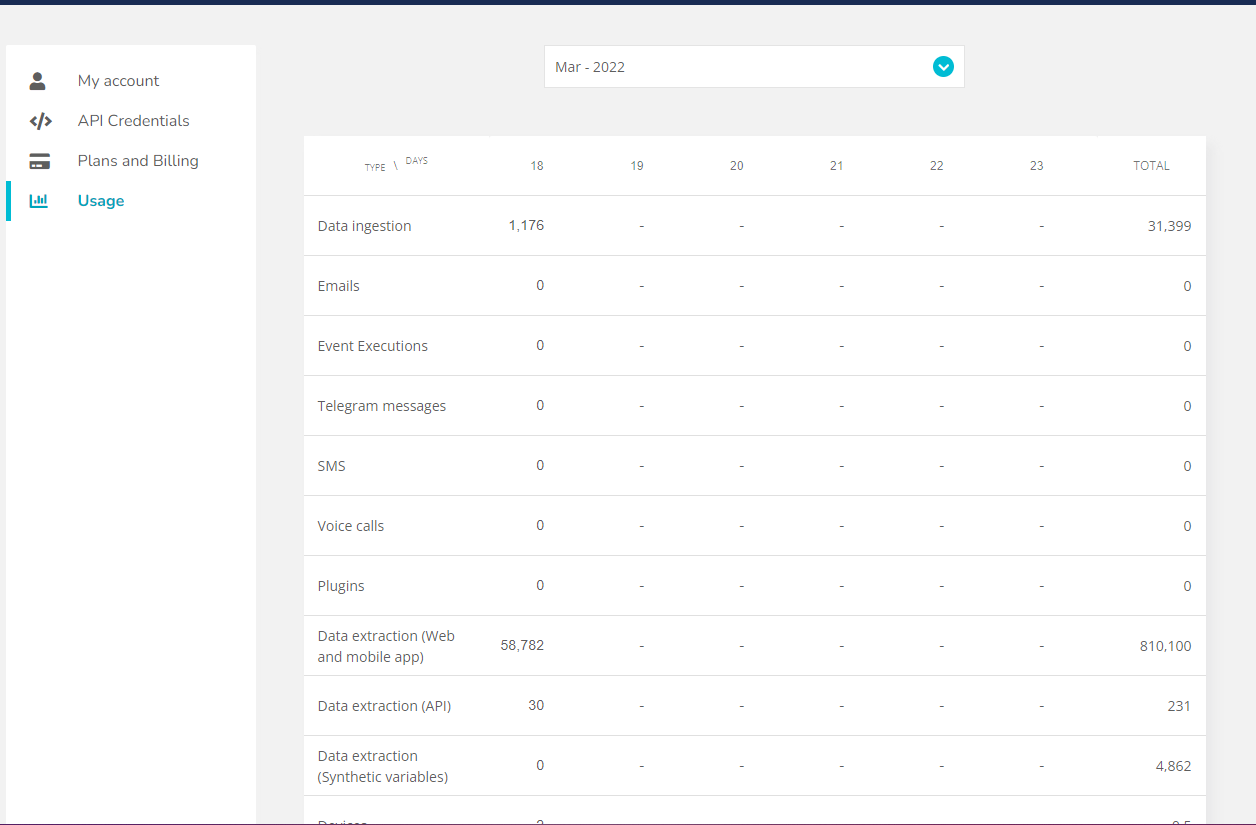
On the other hand, you can monitor the usage of your account (Dots in and Dots out) from the Usage section of your account. Although these readings have a delay to real time values, they do give you a glimpse of the general usage of the account.
Thanks I’ll give that a try
1 Like
I’m testing an application on STEM and also experiencing weird data extraction statistics.
The test device has been sending two simple variables, temperature and humidity, every 30 minutes.
Started the test run on January 8th and everything worked as expected for over a week, until I disconnected the device for about two days.
Upon reconnecting and revisiting the dashboard I encountered the " You’ve reached your daily quota of data extraction" message.
According to the usage statistics the total data extraction for the entire month was 639,371.
If today’s data extraction exceeded 500K, it means that the previous 9 days totaled at about 140K, at a 15.5K daily average.
How could the 15.5K daily average become 500K+ data extraction in about 12 hours, while I wasn’t even using the app?
I’d appreciate any input, since I wasn’t able to find any reasonable explanation to this phenomenon.
Many thanks.
UPDATE: I opened the dashboard late in the afternoon again, and it came back alive with the usage table showing 1,140,002 data extractions this time.
While I’m glad that I can continue the test with a functional dashboard, I’m still puzzled about the cause of this sudden surge of extraction data. If all goes well I’ll migrate the test project to a different tier, so I’m not worried about the 500K data extraction limit, but I’m worried about not being able to decipher what was happening.
Hello @Gabor,
Thank you for your detailed response on this thread, it greatly helps us on the troubleshooting. Just for future reference, any screenshots help too.
This is an issue that we have identified and are now working on it. Please don’t worry, most likely this isn’t due to any action of yours.
Once we have any updates on this, we’ll post them here so that everyone can keep track of this.
Best regards,
Sebastián
Hi Sebastian,
since some days I have a similar problem, my account limit doesn´t seem to have reset.
could you please have a look at my account.
Many thanks
Werner
thanks, today it works again 
Wow - finally I can upload screenshots to the forum here. Great ! ! !
I had this kind of overusage problem several times and still try to find a pattern when it is happening.
At the moment all is working, but the count in the usage panel is strange.
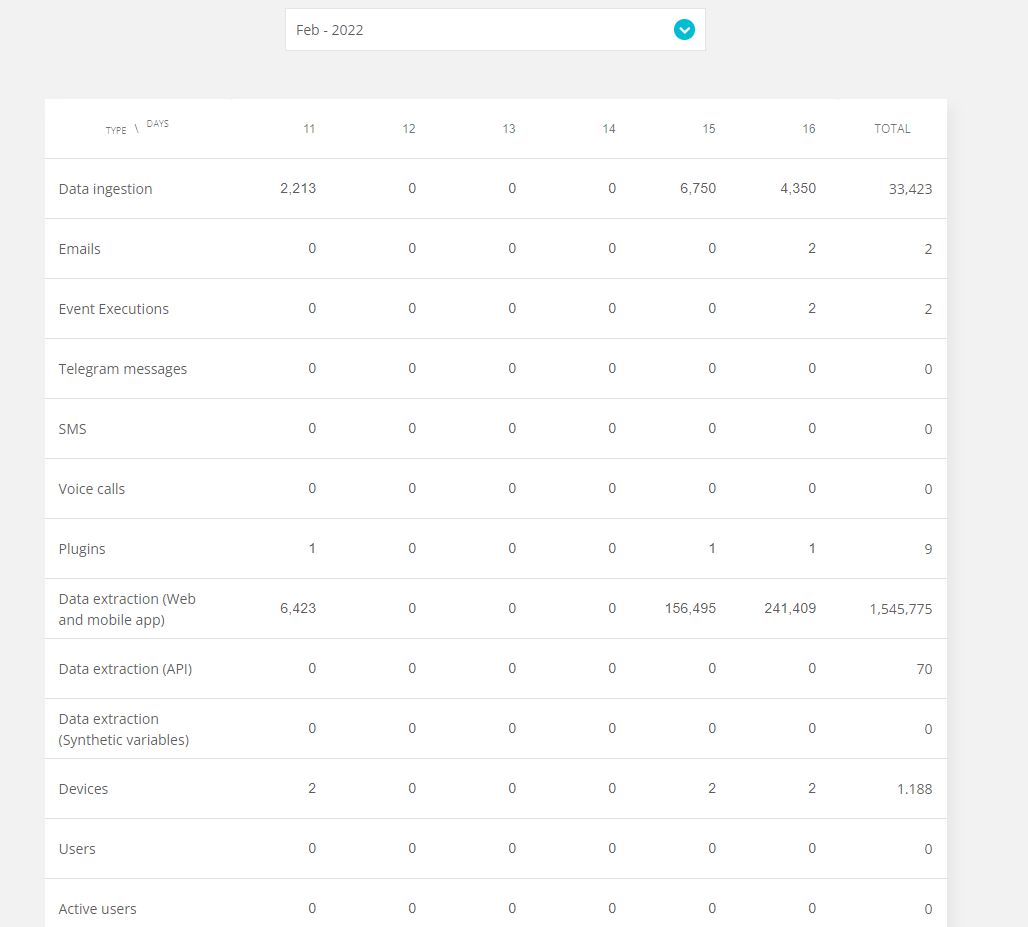
In reality it is always one ESP32 device connected and one (weather) API injecting data, so the real usage should be almost the same since weeks. Still the usage board shows Feb 18,19,20, 21 zero ingestion and zero extraction and all gets added up on Feb 22.
Same usage board for Feb 12 - 14, all zeros. In reality all was connected, data going in and out all working.
When I have time I will simulate an overusage and check how many days the reset takes. Definitely more than 24 hours.
Anyway, this is just for information - thanks for providing a great platform. Keep on doing your great job ! !
here a daily limit overusage screenshot - this might have counted the usage for 3 days.

1 Like
Hi @rising_sun,
Glad to hear you were able to upload images. We appreciate the detailed explanation of the behavior and thanks to that we were able to detect an issue in the dots out reset process related to the usage showing a zero consumption on the entities. The DEV team is already working on a solution. Please receive our apologies for the inconvenience.
I hope to have news in the following days.
Best,
-Isabel
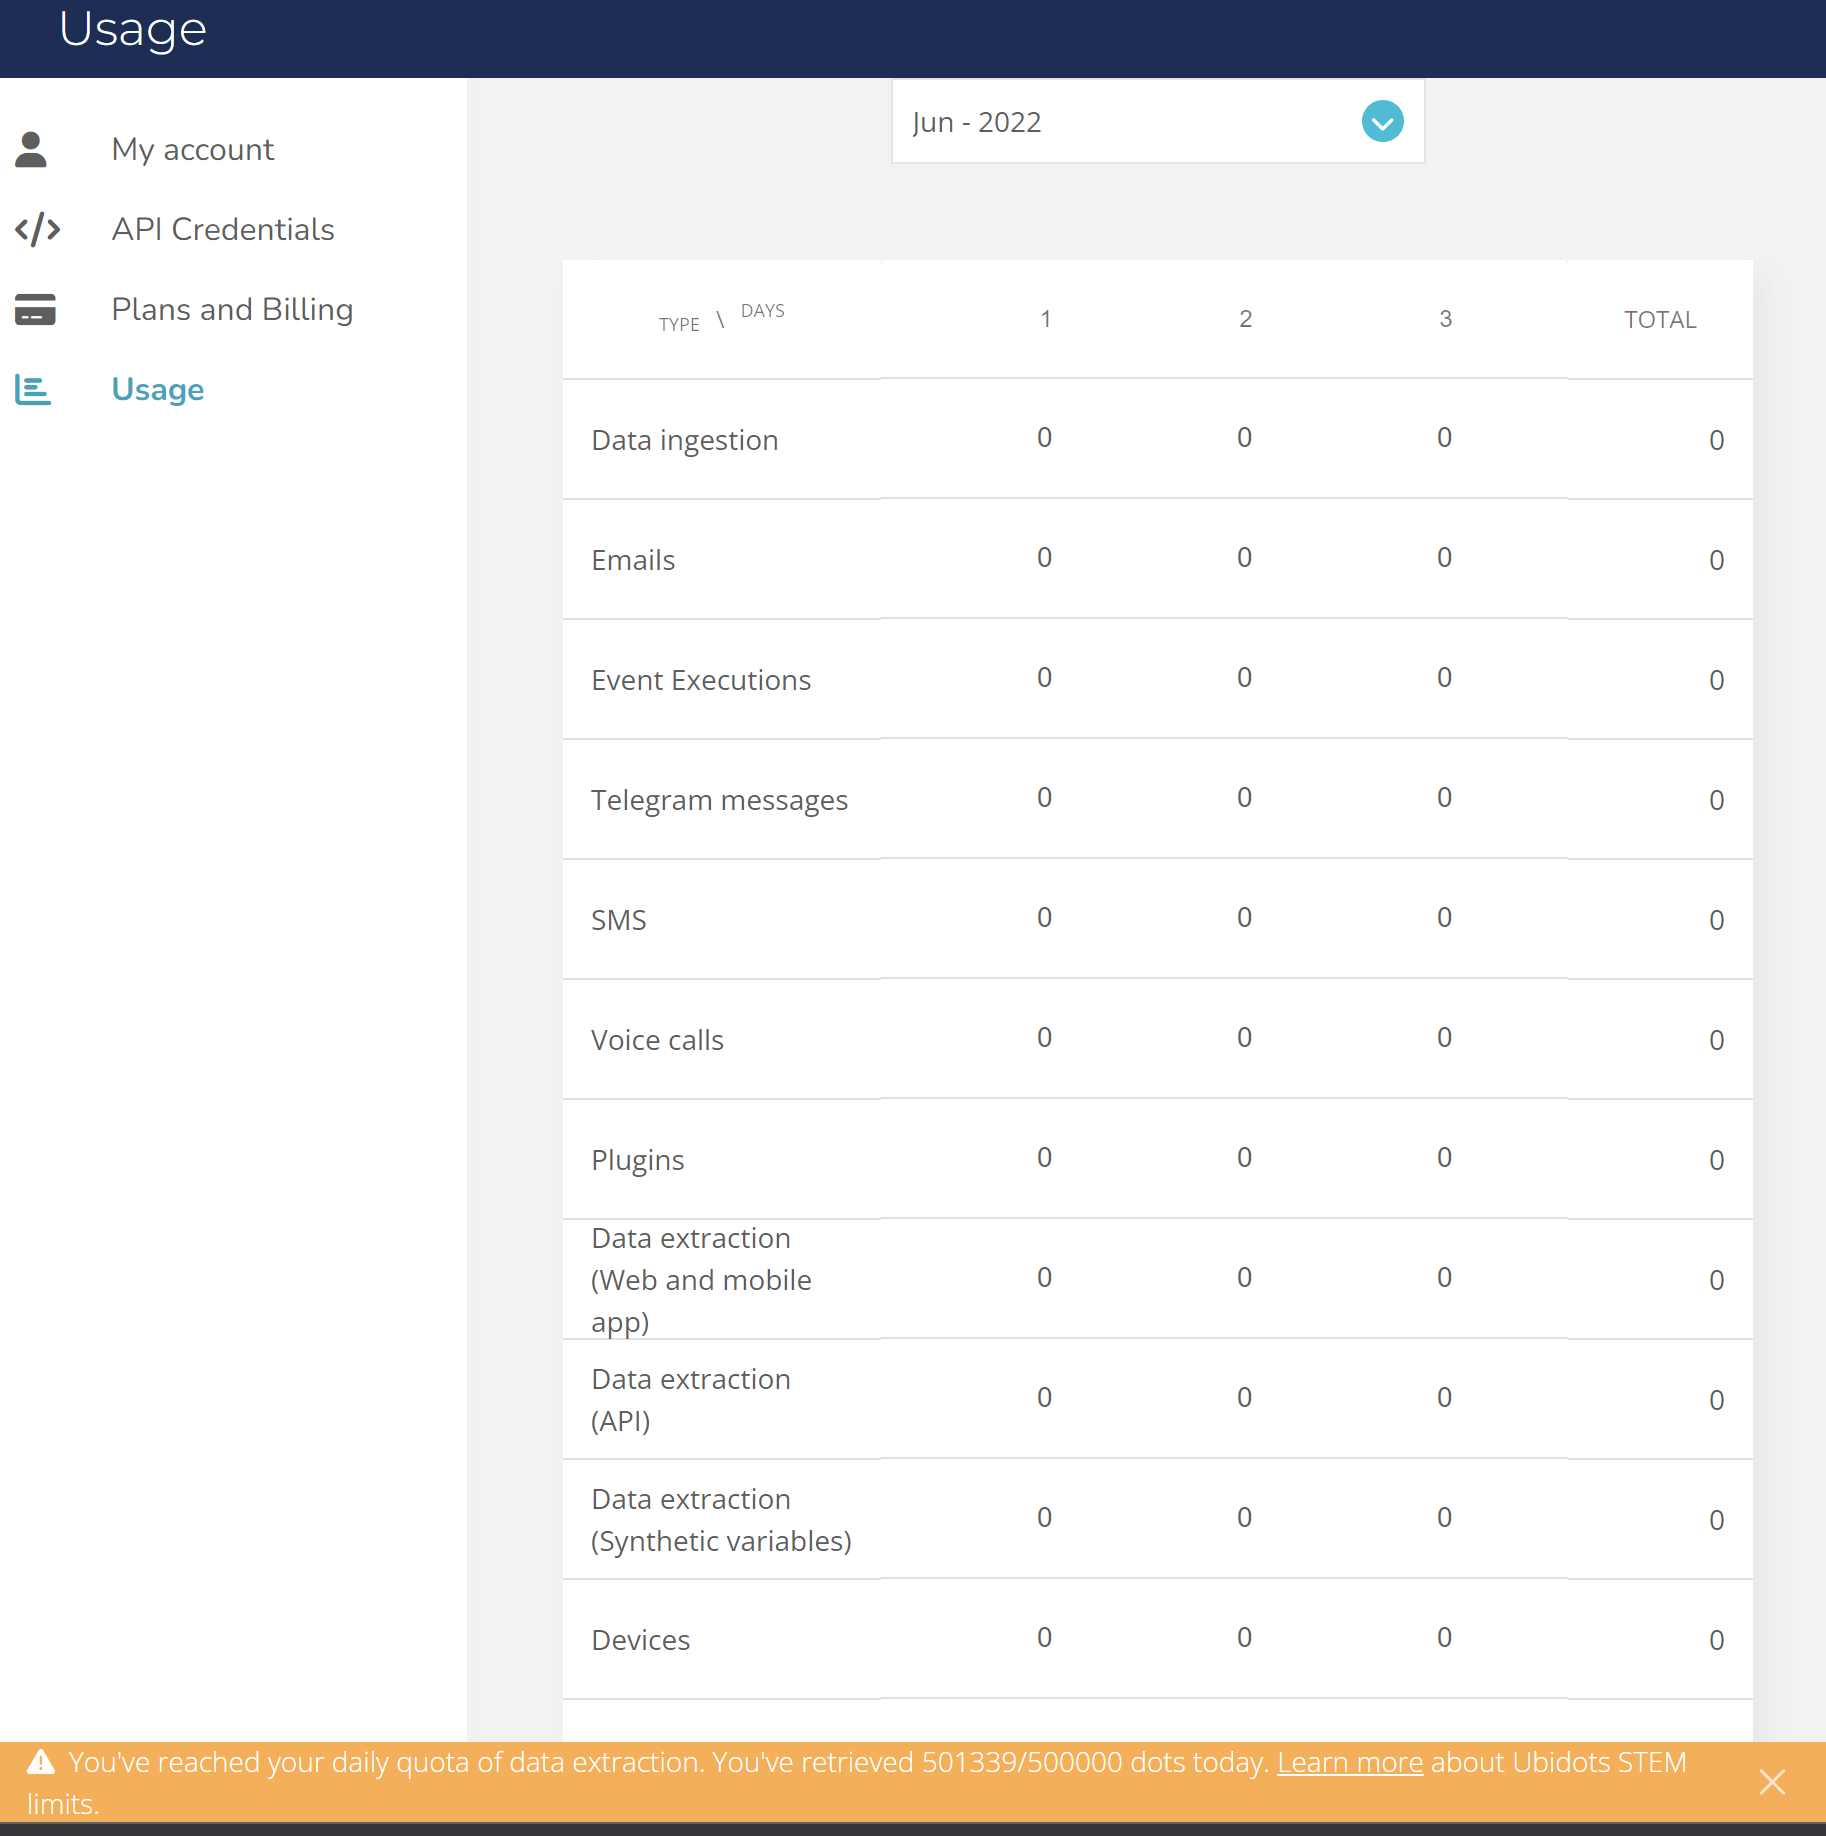
I am getting this error, too.
You’ve reached your daily quota of data extraction. You’ve retrieved 500652/500000 dots today.
My device should send once every 30 minutes.
Can you please look into this? Let me know if I can help somehow.
Robert
1 Like

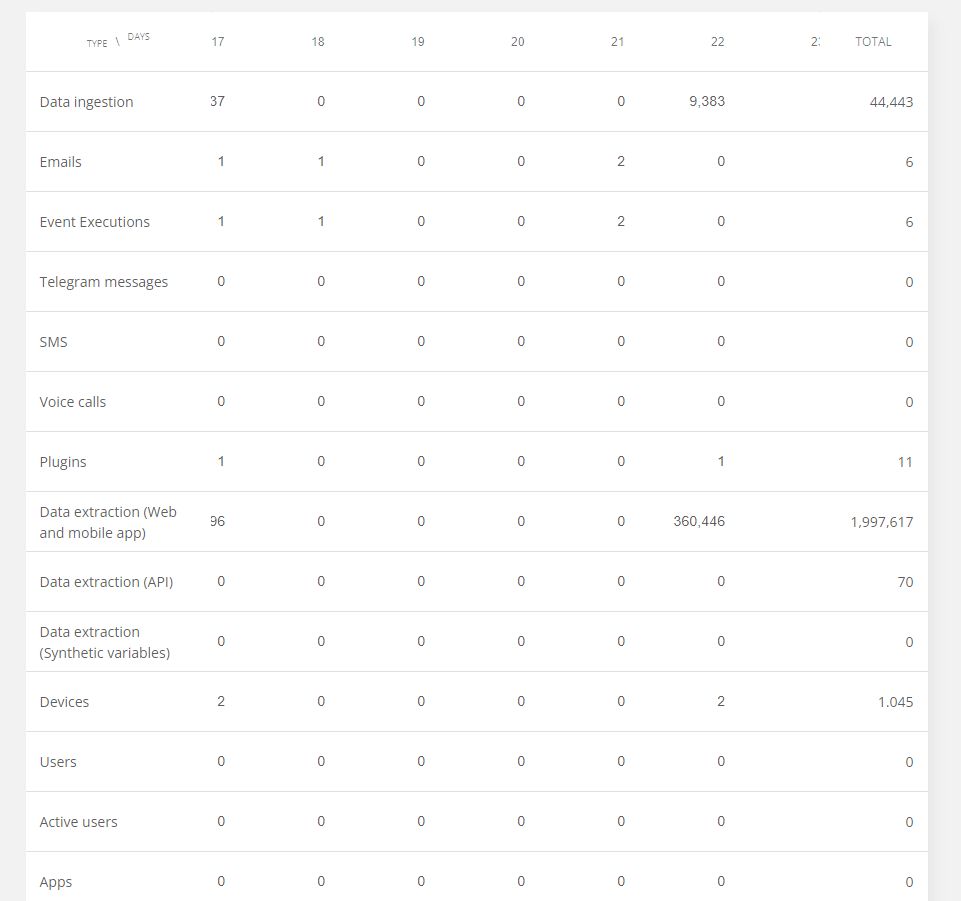
Also the reset of the overusage takes 3 days. I hit overusage 2 days ago and todays usage board (now March 23rd, 7.30 JST) shows zeros for 19th and 20th . . . and hyphens after that. Device shows online but data error in dashboards. See screnshot.
1 Like
Hm, now the quota message is gone, and I get an unhelpful “Error loading your data Something went wrong on our end and we were unable to load your data.” message in my widgets. Logging out and in again did not help. Looking at the browser console, I see a 402 payment required error. This should probably be better communicated. Should this still happen if I don’t hit my limits?
just an update for those of you working on the dot counting problem.
It seems like 2 or 3 days all dots usage gets summed up, then this total sum hits “overusage” and then it takes another 3 days for the dots to reset (which I thought would happen every 24 hours).
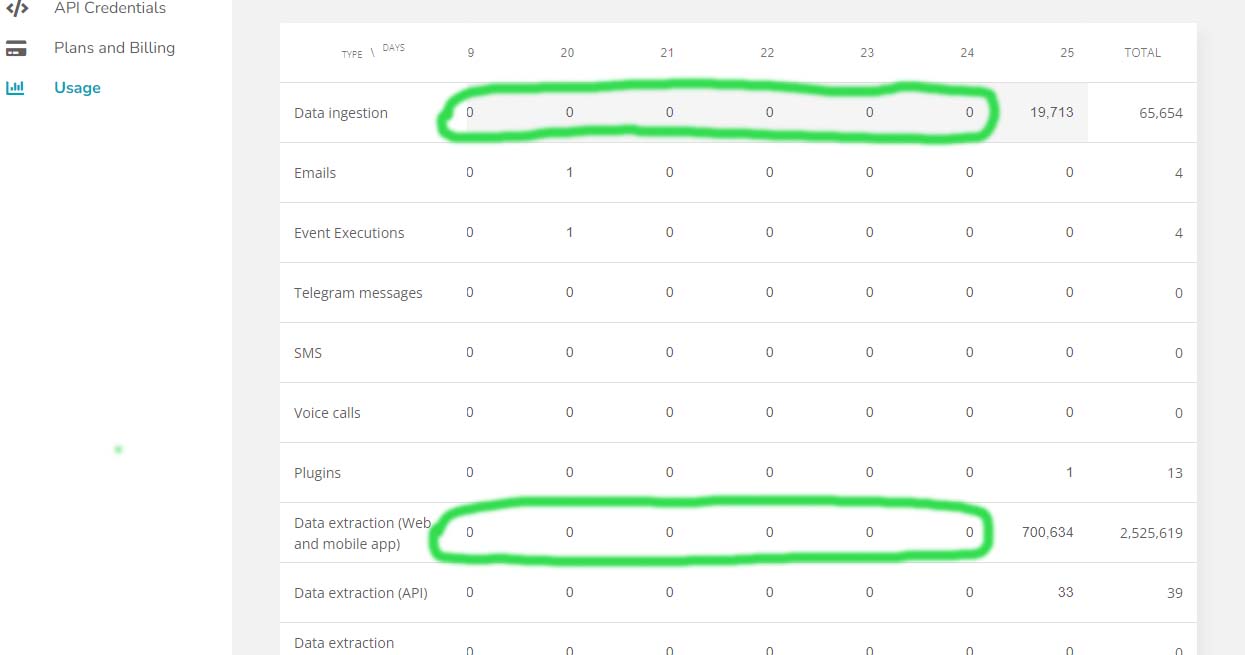
Finally today March 26th data reappear in dashbords. During all the last days, device was online, ingesting data, even triggering an event Email, but usage board (screenshot) shows one week only zeros.
Just for your information to find the count/reset problem. Thank you.
1 Like
Hello @rowe, getting 402s could be caused because of hitting the limits of Dots in or Dots out. It seems strange that you were still having problems loading your data even after the Quota message was gone.
I’ll add this to the ticket that is reporting these cases so that it hopefully gives more resources to the Developer in charge of it.
Thank you for the shared information.
Thanks Sebastian! It started working again a few days ago, without me changing anything. I have no idea why it happened or what fixed it.
1 Like
This is happening to me too. I send data off once every other minute. The usage graph shows I have used 47,000 while the warning states 501,338.
Any help would be appreciated ![]()
A similar situation, the data is not displayed since March 19. 3 devices of 6 variables with a frequency of 15 minutes.
1 Like