Hi
I have had very high usage recorded in the last day or so.
This is incorrect.
Is this a regression issue? cf Usage metric wrong
Andy
Hi
I have had very high usage recorded in the last day or so.
This is incorrect.
Is this a regression issue? cf Usage metric wrong
Andy
Hello @andy.krafft
I hope this message finds you well.
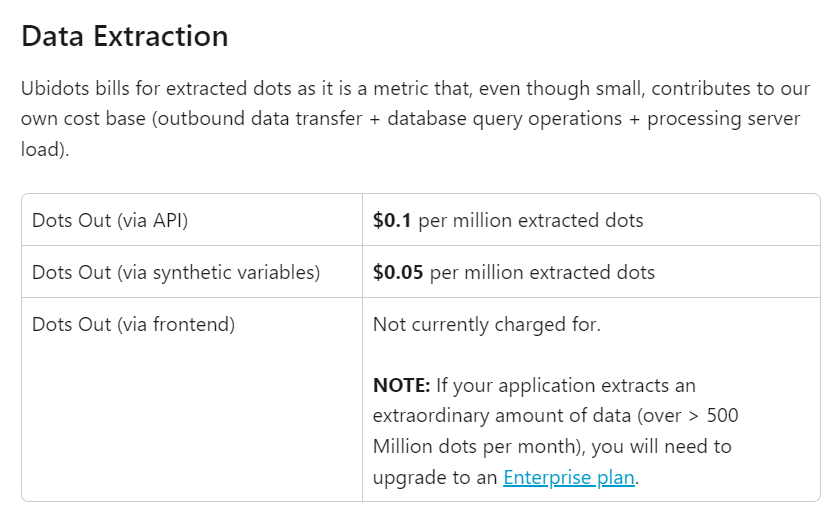
The count of dots out in data extraction (web and mobile app) indicates the number of internal requests made to display data in your dashboards. If you notice a significant increase on a particular date, it might be because you created more widgets in your dashboard. Consequently, this leads to higher data extraction.
Another possibility is that on that date, you opened your account on additional devices (laptops or phones), which also impacts the data extraction count. However, there’s no need to worry about this count; you can continue using your account normally.
Best regards,
Alejandro
Hi Alejandro
None of these are correct. Nothing has changed in the last several years.
I have noticed this overcount has been occuring more regularly recently.
My concern is that this old bug has reappeared.
Please check the old thread I referenced.
To repeat, my dashboard, widgets, data streams, etc, etc have not changed and yet the count is showing incorrectly.
Andy
Maybe did you add more variables or even more devices to your account on June 20? However, I will investigate this further.
Alejandro
Hi Alejandro
No. As explained in my previous post, nothing has changed in several years.
Thank you for investigating further.
Andy
Hello again @andy.krafft
I reviewed the post you sent me from a few years ago and wanted to highlight some important points:
We can confirm that there is no problem on our end. Please remember that the following operations may increase the quantity of “dots out” for this count.
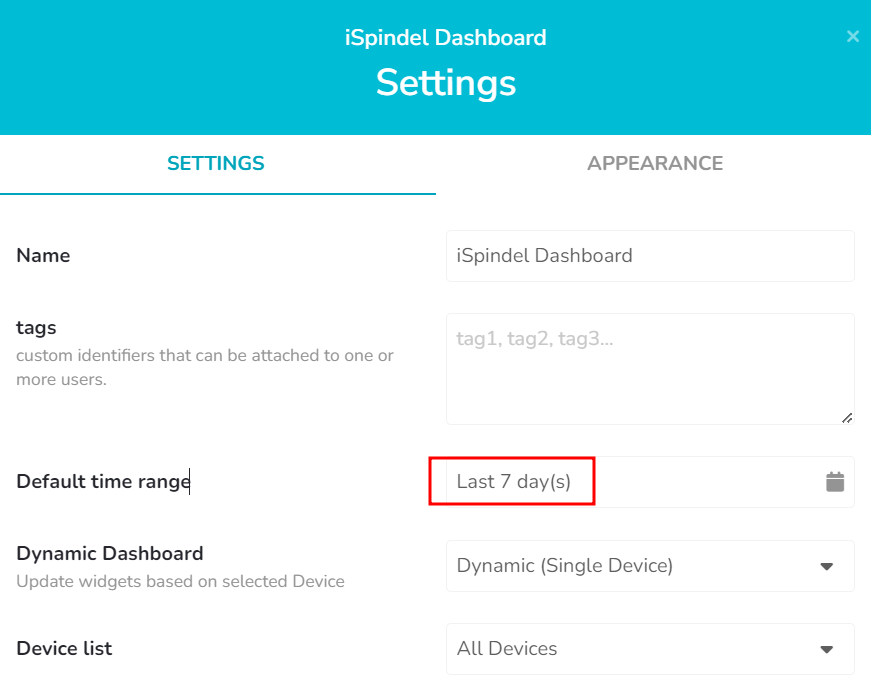
For example, your default time range is set to the last 7 days. I recommend changing it to the last 24 hours or even just the last hour. This is important because every time you refresh your dashboard, close and reopen the Ubidots window, or log out and log back in, a new request is sent to our database, causing the “dots out” in the Frontend to increase. With a time range set to the last 7 days, the amount of data requested is significantly greater than if you configure it for just the last hour.
Please let me know if you need something else.
Best regards,
Alejandro
Hi Alejandro
Thanks for taking the time to make such a thorough investigation.
Whilst I agree with all your logic and findings, nevertheless I cannot escape the empirical fact that nothing in my set up has changed in the last 4 years and yet in the last few days I seem to be exceeding the free tier limit.
I refresh every day or so - and once again bear in mind that neither the config nor my behaviour has varied over the years - and yet the situation has gone from an understandable count of dots out to one that would require me to be refreshing considerably more to exceed the free tier.
As you have suggested I have changed the default time range to be one hour.
Andy
Hello @andy.krafft
Thank you for your understanding. We suggest monitoring the situation for a couple of days during our one hour default time range operation. After that, we can assess whether the count decreases.
Best regards,
Alejandro
Hi Alejandro
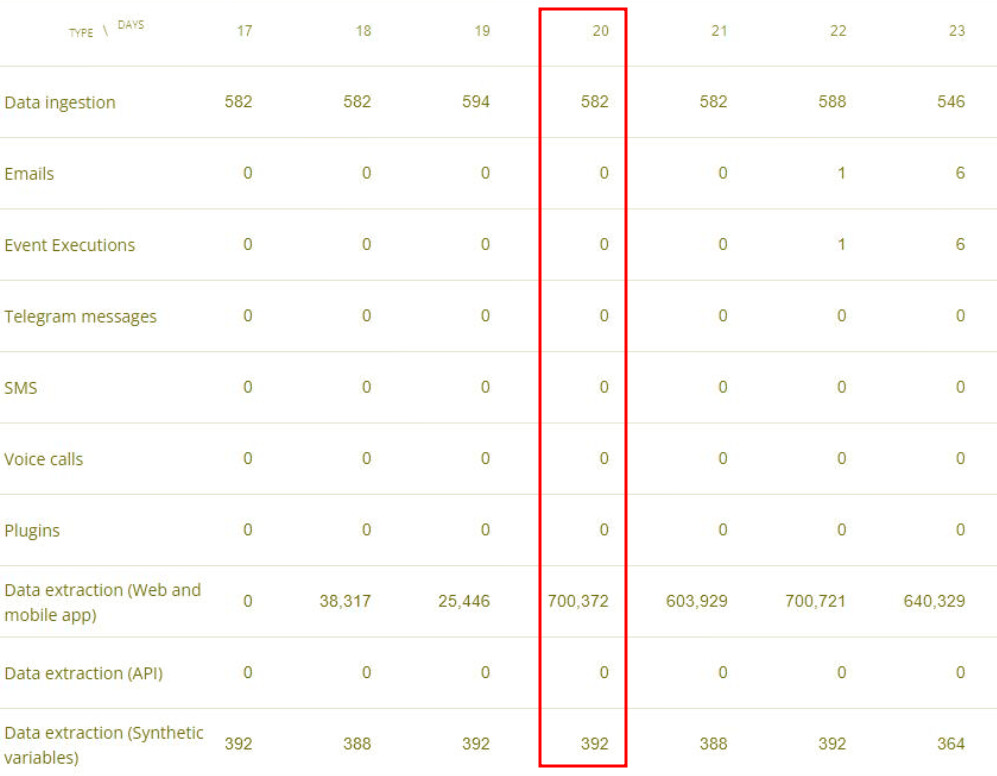
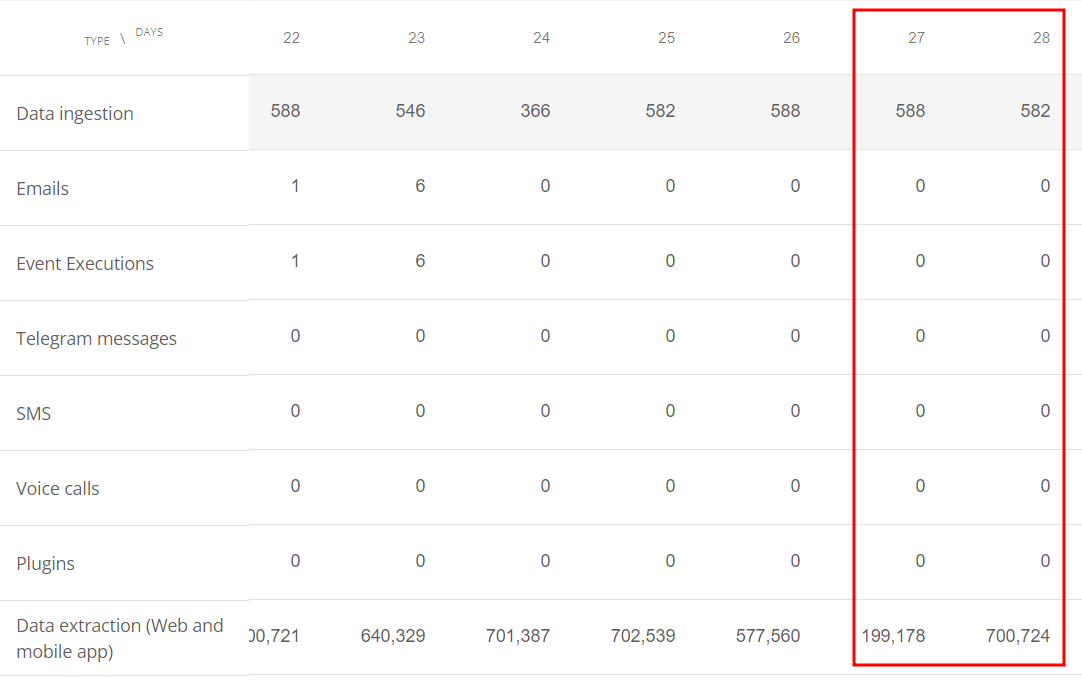
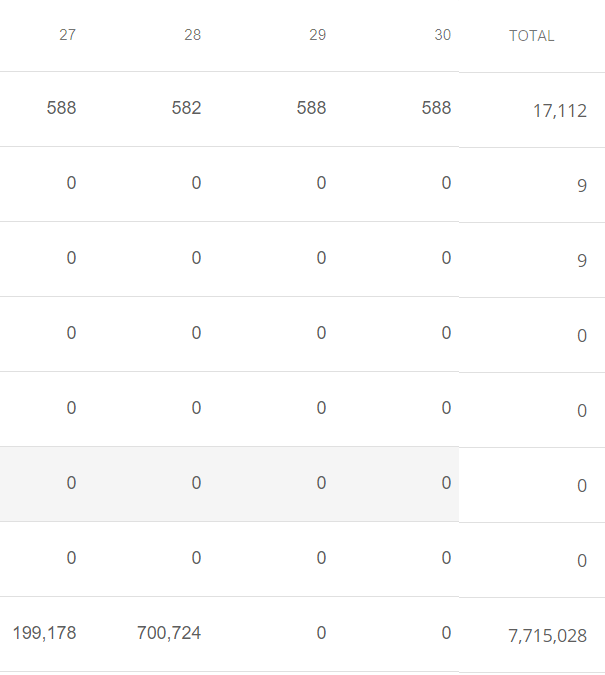
As a test, I did quite a lot of refreshing, etc two days ago: dots out 199,178.
Yesterday I did one dashboard refresh: dots out 700,724.
What’s the explanation?
Andy
Hello @andy.krafft
We tally all the metrics daily at midnight, with the results reflecting the previous day’s counts. For instance, if you conducted tests on June 26th, the metrics will be available on June 27th.
If you did a lot of refreshing on June 27th, you will see 700,000 dots on June 28th. On the other hand, if you only did one refresh on June 28th, you’ll see 0 dots on June 29th.
I’ll be attentive.
Alejandro
Hi Alejandro
Yes I know you have this unique T+1 way of labelling the days - hence why I deliberately avoided the use of dates in case it caused ambiguity.
My findings still stand: on the 26th (shown as 27th) I did a lot of refreshing. On the 27th (28th on your report) I did one refresh.
Andy
Oh got it @andy.krafft
That’s indeed an error. Let me run a small test. Could you stop the dashboard from refreshing today? I would like to see the counting in your account tomorrow.
I have refreshed a couple of times today but not for the last few hours and will not do any more for the rest of the day.
Perfect, we will wait until tomorrow Andy.
Hello again Andy,
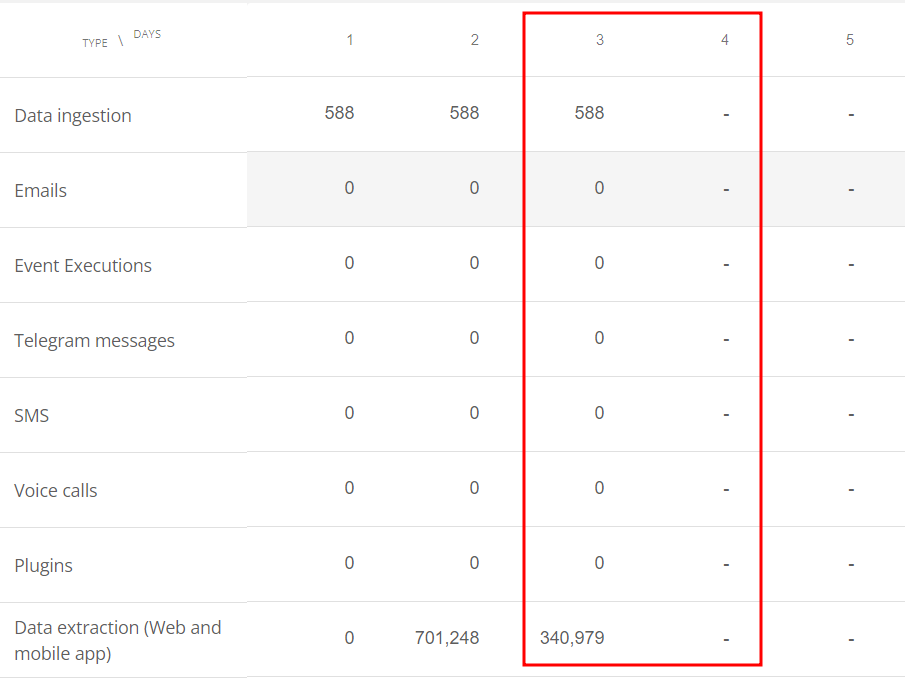
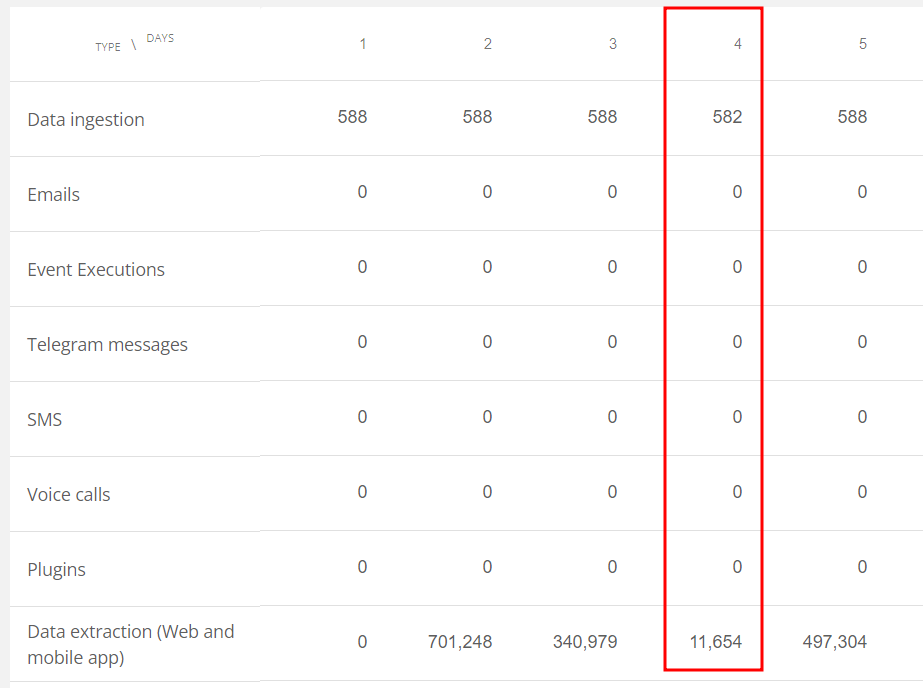
After a couple of days, we’ve reviewed the usage in your account. You last refreshed the dashboard on the morning of July 3rd, and as of July 4th, the usage shows a consistent 11,000 dots.
Let me know if you have any comment or question.
Alejandro
Hi Alejandro
So 3rd June I used 11,654 dots.
How come I used 42 times as many yesterday when I only refreshed once (or at most twice)?
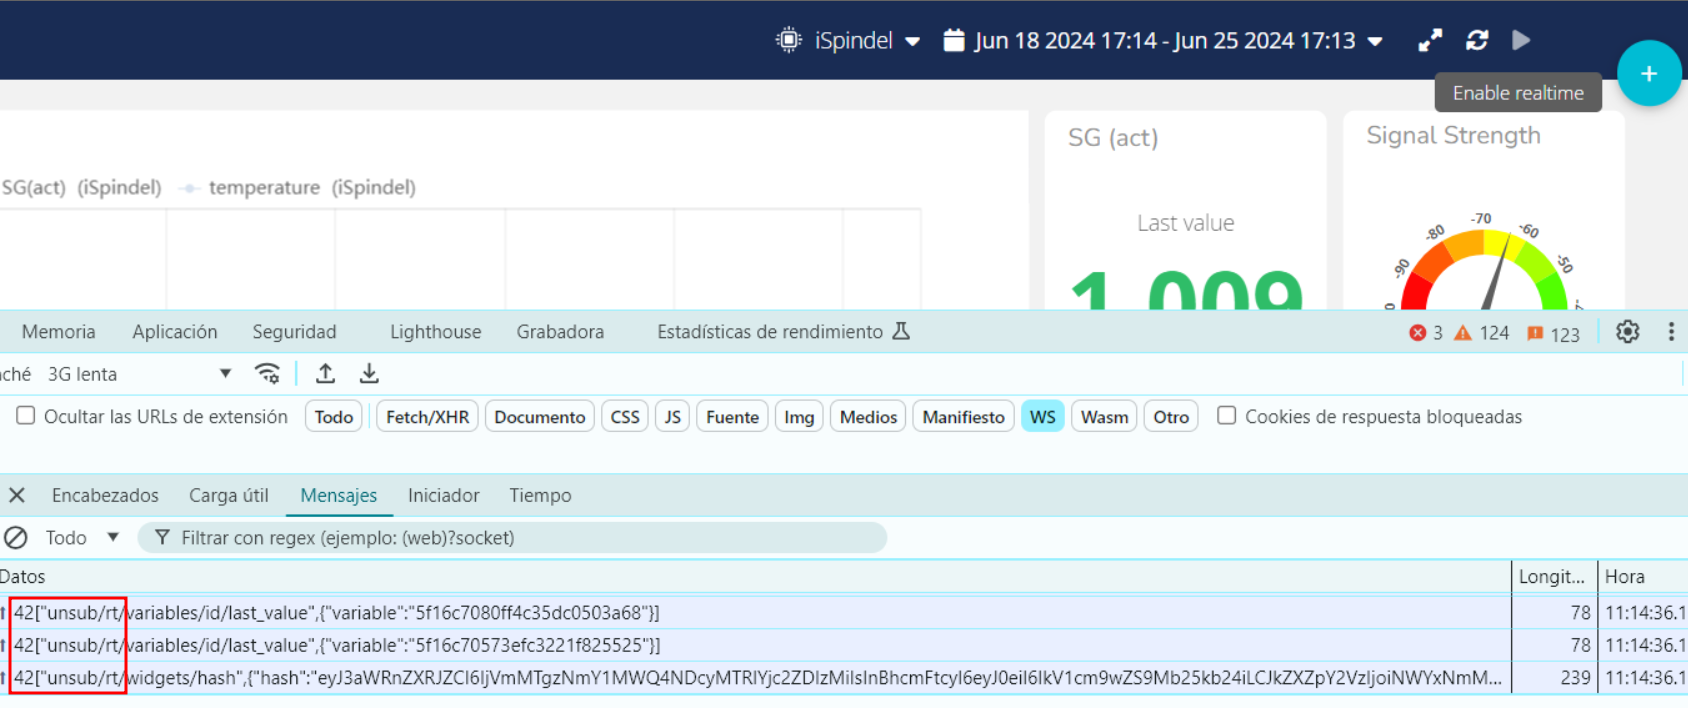
To answer my own question, I have noticed the real-time function being enabled without me clicking on the icon.
When it first happened I thought maybe it was just a mistaken mouse-click on my part. But it has happened 3 times now (to my knowledge, so quite likely more) which would, of course, explain the high dot count.
Andy
I turned it off a few seconds ago. Then I refreshed the page (F5) and it turned back on!
I’ve tried it a few times now and every time Chrome refreshes, the feature gets re-enabled.
Is it necessary to refresh the browser? Yes, each time you press F5, real-time data will be enabled again. This feature ensures that Ubidots can display data in real-time, which is one of our main functions.
Additionally, could you please explain how the 700,000 dots out would impact your operation? As I mentioned earlier, it doesn’t affect your account. Even with paid licenses, there is no impact, as this isn’t a cost item.
No I don’t deliberately refresh but when I swap back to the webpage after some time, Chrome swaps it back into memory and does a refresh.
I must admit I was not aware that the automatic reenabling of real-time was by design. I don’t recall this being the case - is this a newly introduced feature? Can it be permanently disabled?
Hmmm, it does seem to affect my use of the dashboard: when I run out of dots I get an error message.
Hello Andy,
I understand that every time Chrome refreshes the memory, the Ubidots page also refreshes, causing the dashboard to revert to its default behavior with real-time updates enabled. Unfortunately, this feature cannot be disabled. However, I’m curious to know why you want to disable it permanently. If the real-time updates are not active, what is the purpose of displaying the data on the dashboard if it’s not being updated?
I see that you have configured a default time range of 1 hour in your dashboard, which is perfect. My additional recommendation is to reduce the frequency of data transmission to your device. Currently, it’s set to 1 value every 15 minutes. Increasing this interval to 30 minutes should help prevent you from reaching the 700,000 limit again.
I’ll be attentive if you need further assistance.
Alejandro