

Benefits
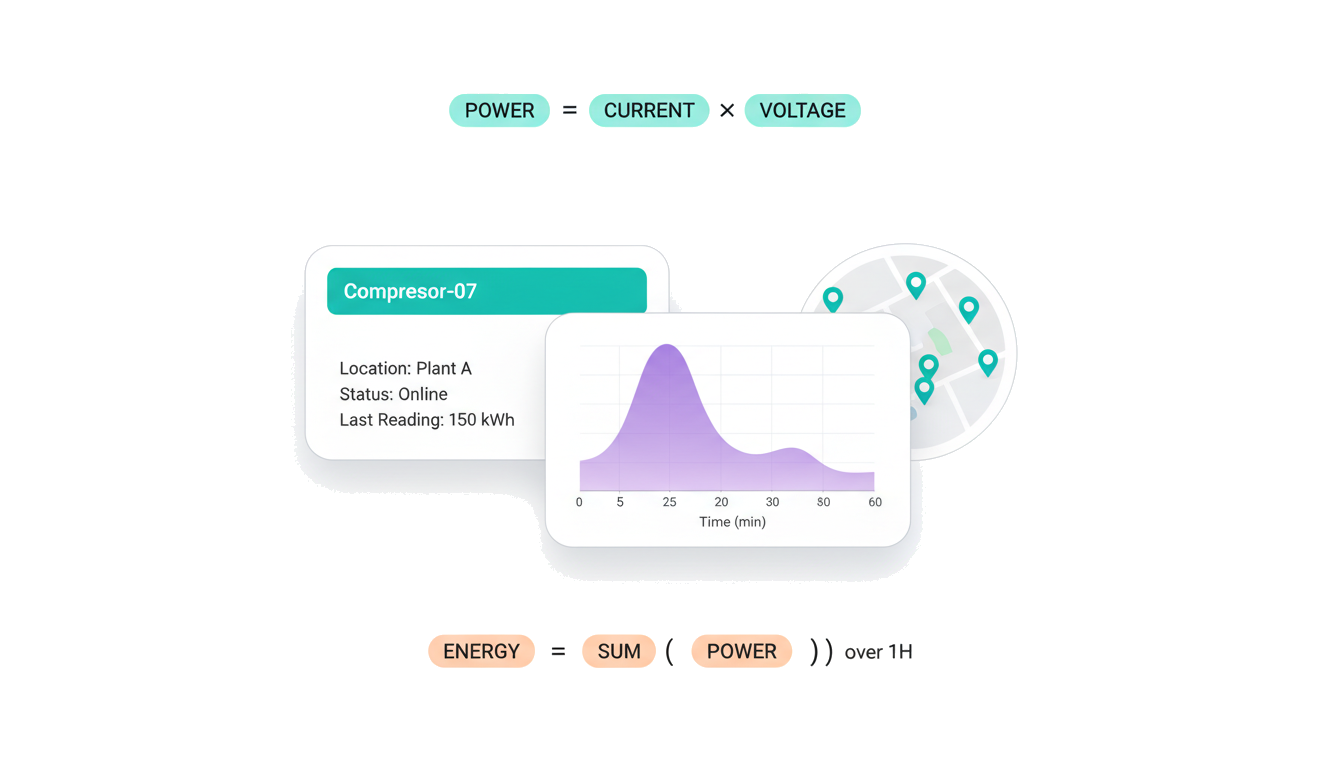
Multiply power readings by time to get kWh per device, floor, or facility — ready for billing or reporting.
Transform voltage or current outputs into real engineering units like temperature, pressure, or flow rate.
Divide actual output by rated capacity to compute real-time OEE, COP, or utilization rates.
Apply rolling averages to eliminate measurement noise and get stable, reliable values for dashboards and alerts.
Use if/else conditions to label data — mark a motor as overloaded, a tank as low, or a trip as out of route.
Chain synthetic variables together to model complex processes like cumulative production totals or multi-stage efficiency.
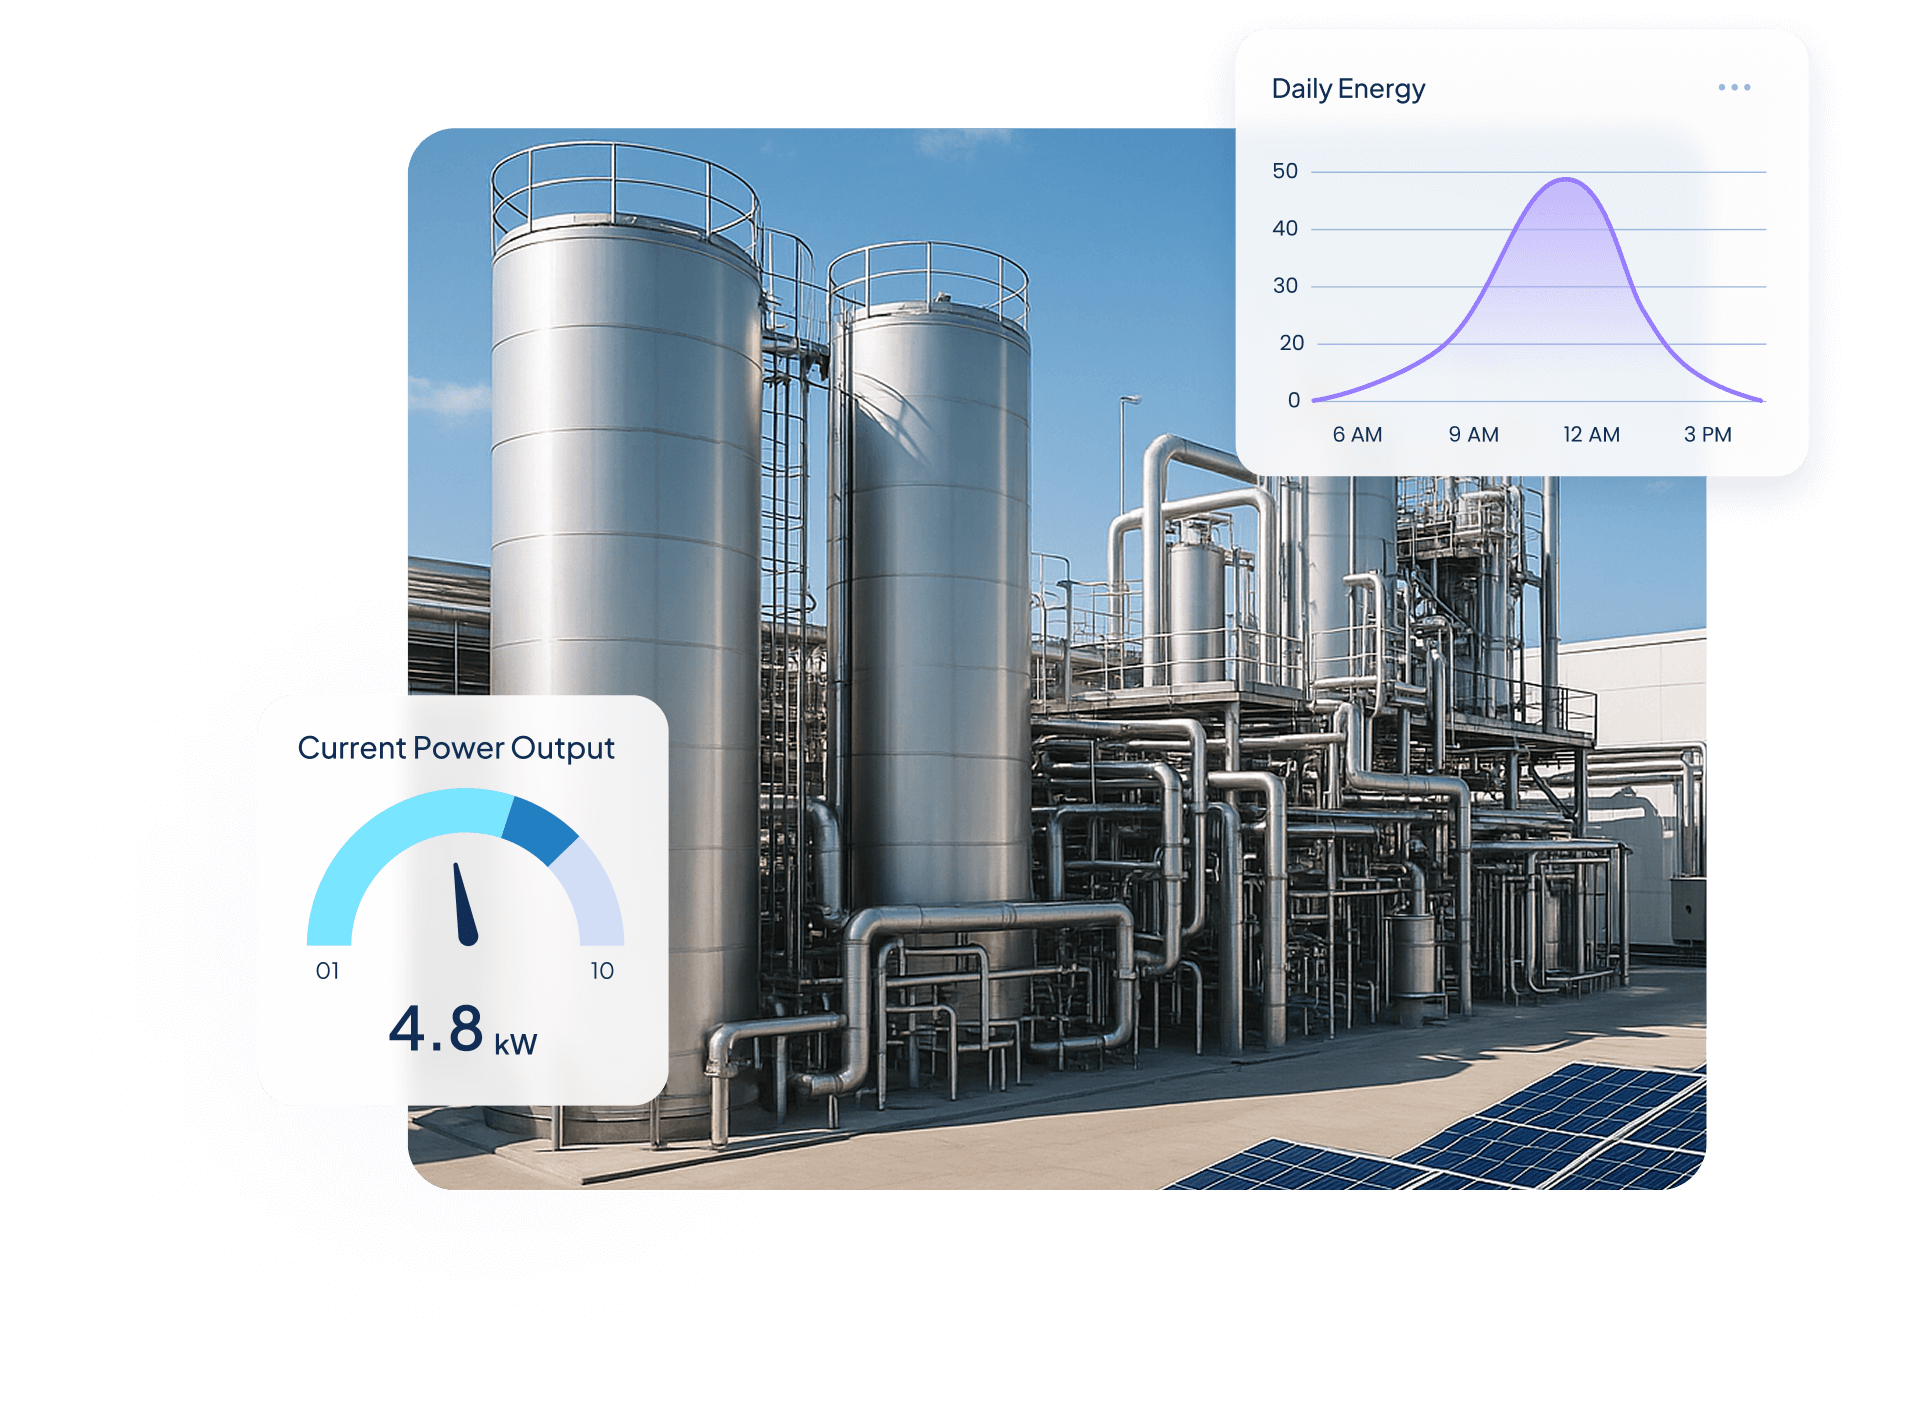
See It in Action


How it Works
Every IoT deployment generates raw readings: voltage, pulses, counts, temperatures. Synthetic Variables let you define the metrics that actually matter to your business — and keep them updated automatically as new data arrives.
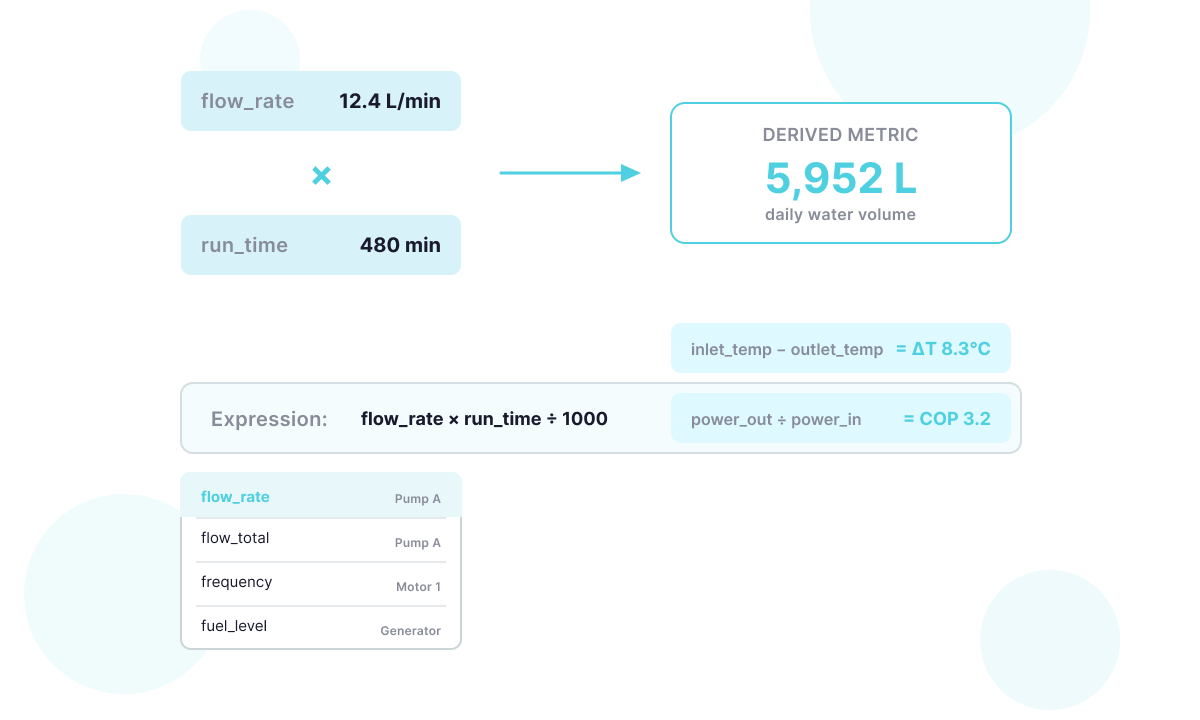
Write an expression that combines your existing variables using math, logic, and aggregation functions. Multiply pump flow rate by run time to get daily water volume, or compare inlet vs. outlet temperature to calculate heat transfer efficiency. The editor autocompletes your device and variable names so you don’t need to memorize IDs.

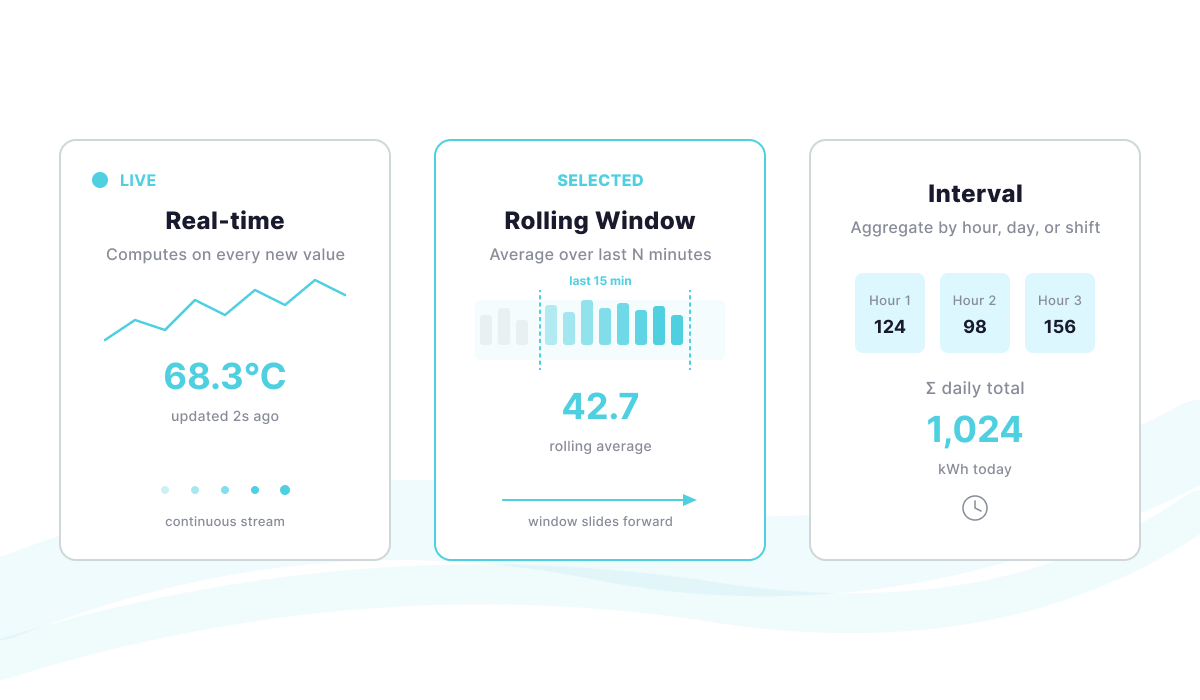
Set whether the variable computes from the latest incoming values (real-time), over a rolling window (e.g., last 15 minutes), or aggregated by interval (hourly kWh, daily production totals). The platform recalculates automatically — no cron jobs or scripts to maintain.
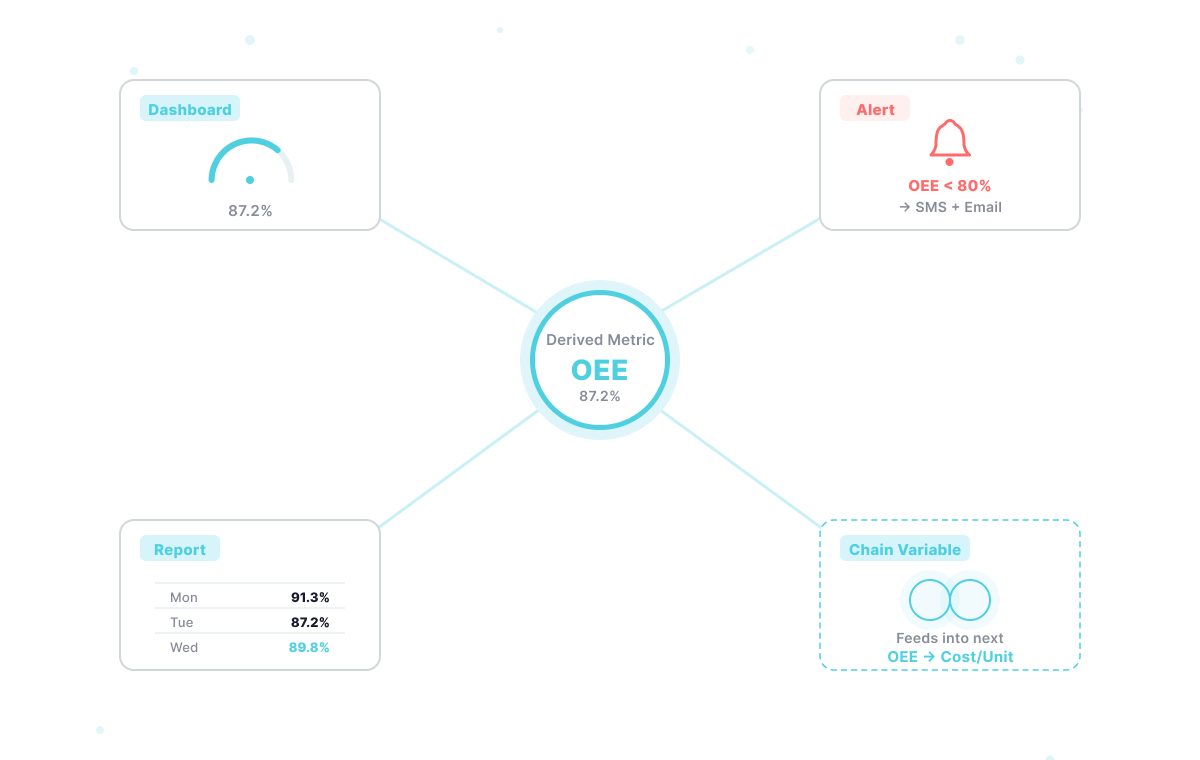
Your derived metric becomes a first-class variable: display it on dashboards, trigger alerts when it crosses a threshold, include it in reports, or feed it into another synthetic variable for multi-step calculations. One definition, used everywhere.

Key Features
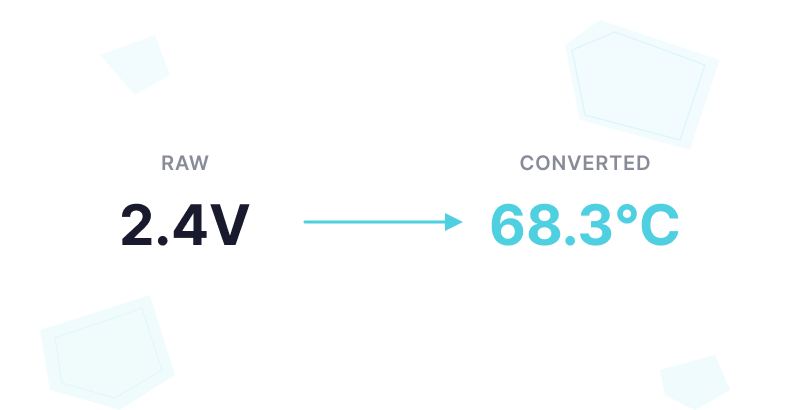
Convert raw sensor outputs — voltage, resistance, pulse counts — into meaningful engineering units like °C, bar, or liters/min.

Calculate cumulative kWh, liters, or cubic meters from instantaneous readings to drive billing and sustainability reports.

Compute OEE, COP, yield rate, or any ratio that compares actual vs. expected performance across assets.

Apply sliding-window averages to reduce sensor noise and produce stable values for alerting and visualization.

Aggregate data by hour, day, or shift — mean, sum, min, max, count — without exporting to an external tool.

Label assets or readings using if/else logic: normal / warning / critical, idle / running / faulted, in-zone / out-of-zone.

Reference variables from multiple devices to compute site-level totals, fleet averages, or differential measurements.

Keep metrics consistent even when sensors miss readings — fill gaps using forward-fill, last known value, or a fixed default.
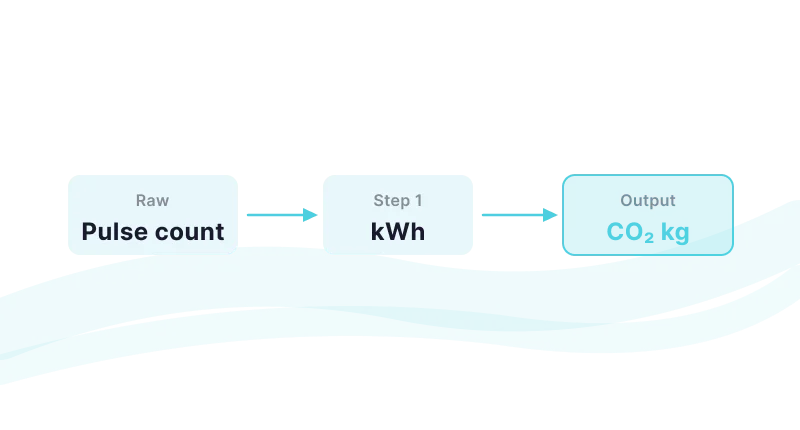
Use a synthetic variable as input to another one to model multi-stage processes — from raw pulse count to monthly carbon footprint.
Quantify Environmental uses wireless IoT sensors and Ubidots dashboards to turn utility data into real-time insights, helping industrial clients monitor water, energy, and gas use, detect inefficiencies, and act before costs rise.
$250,000+ in annual client savings through optimized water, electricity, and gas consumption.
Millions of liters of fresh water conserved and tons of CO₂ emissions prevented driving measurable sustainability outcomes.
Improved operational oversight with real-time visibility into utility usage and equipment performance.
Success Story


Use Cases


Steve Barker
Founder & CEO
Prospect Control uses Ubidots to deliver remote tank level monitoring for industrial customers, replacing complex PLC/SCADA setups with a scalable, web-based IoT solution.
Results:


Darryl Schembri
General Manager
AIS Technology uses Ubidots to monitor electricity, water, and gas consumption across multi-tenant buildings, enabling real-time visibility, automated billing, and faster response to inefficiencies.
Results:


Onofre Tamargo
CEO & Cofounder
S4IoT uses Ubidots to remotely monitor irrigation systems in urban gardens, helping clients reduce maintenance costs, prevent plant loss, and shift from manual operations to a scalable subscription-based model.
Results:


Help & Support
Have questions about Ubidots? Here are some ofthe most common queries to help you get started.
Synthetic Variables let you define calculated metrics derived from your existing device data — directly inside Ubidots, with no backend code required. Use them to compute energy consumption, convert raw sensor signals into engineering units, track equipment efficiency, or flag anomalies with conditional logic. Results are available across dashboards, alerts, and further calculations.
Synthetic Variables support a wide range of operations: unit conversions (raw voltage or current into engineering units), energy and consumption tracking (power × time = kWh), efficiency ratios (OEE, COP, utilization rates), rolling averages to smooth noisy sensor readings, interval aggregations, conditional classification using if/else logic, and cross-device metrics.
Both. You can configure a Synthetic Variable to compute in real time as new device data arrives, over a rolling time window (e.g., a 15-minute moving average), or on a fixed interval for periodic aggregations like hourly totals or daily summaries. The computation mode is set per variable, giving you precise control over how and when each metric updates.
Yes. Synthetic Variables are configured entirely within the Ubidots interface — no backend code, external APIs, or data pipelines required. You define your formula using an expression builder, select the input device variables, set the computation timing, and the result is immediately available as a regular variable across dashboards, alerts, and reports.