


Benefits
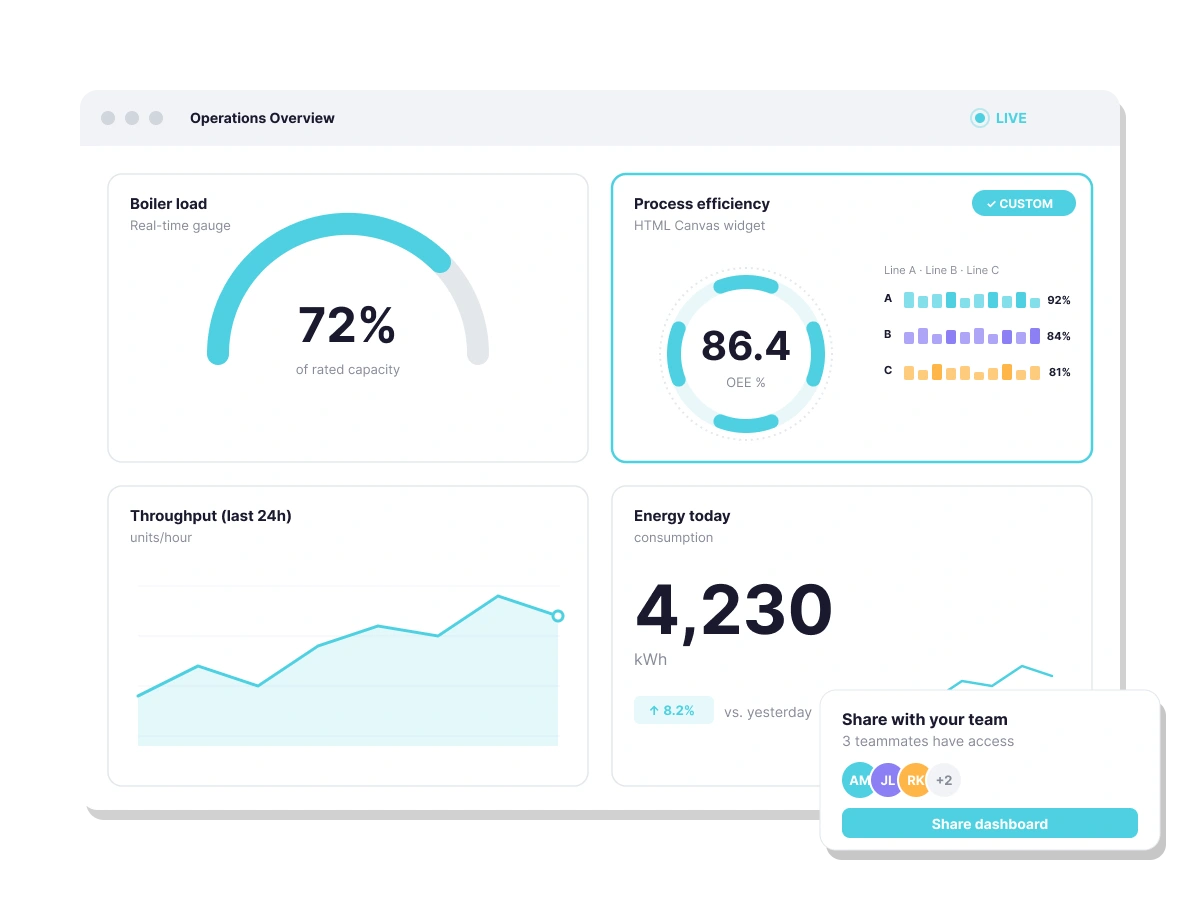
Standard widgets cover most use cases — but not all. HTML Canvas removes the ceiling on what’s possible, letting you design and code visualizations that match your exact requirements.
Write your own HTML, CSS, and JavaScript directly inside Ubidots. No need to build a separate front-end or work around platform constraints — your custom logic lives right alongside your IoT data.
HTML Canvas supports external libraries, so you can bring in your preferred charting tools, UI frameworks, or custom scripts and have them render seamlessly within your dashboard.
With built-in settings like lazy loading and dashboard data preloading, custom widgets are optimized without requiring extra engineering work on your end.
See It in Action

How it Works
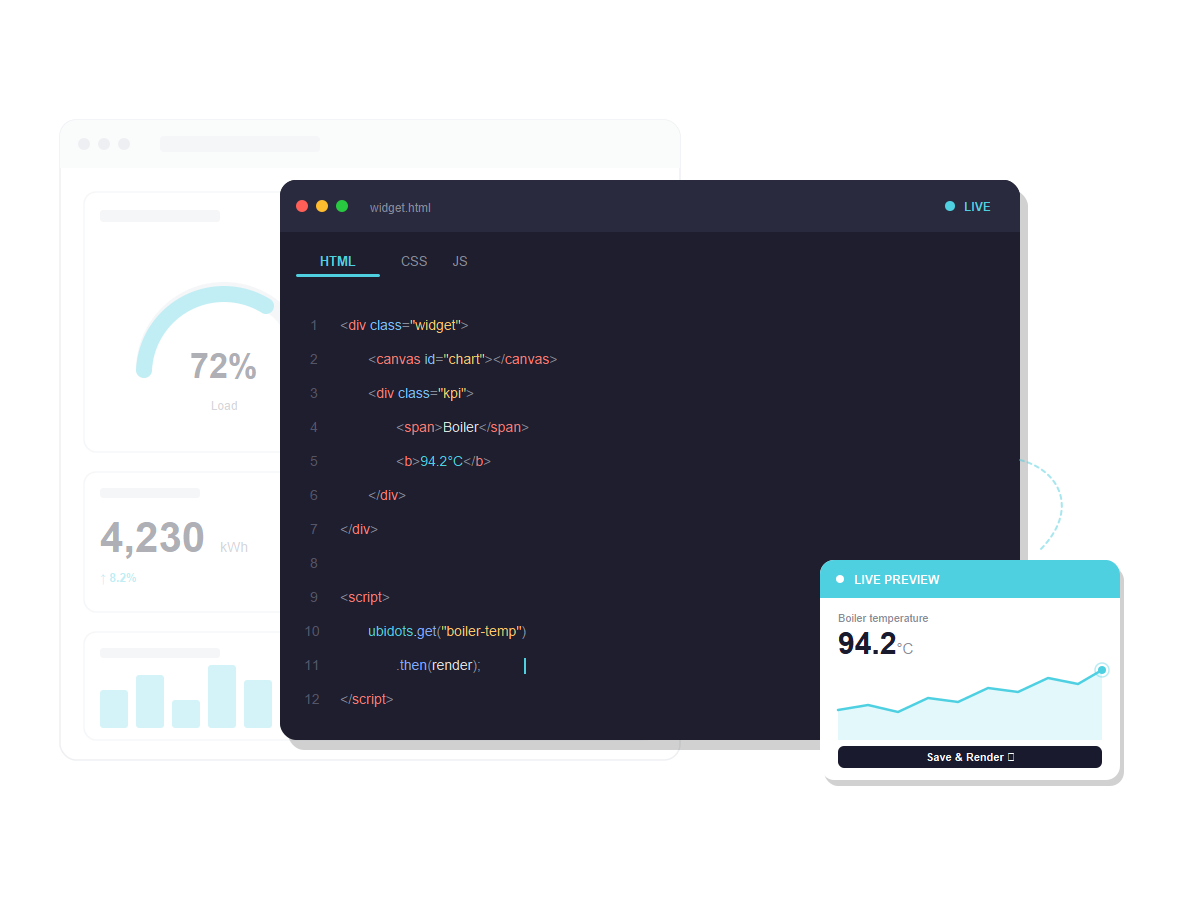
HTML Canvas gives developers a built-in coding environment to create, test, and display custom widgets directly within the platform — no external tools or separate deployments required.

Key Features
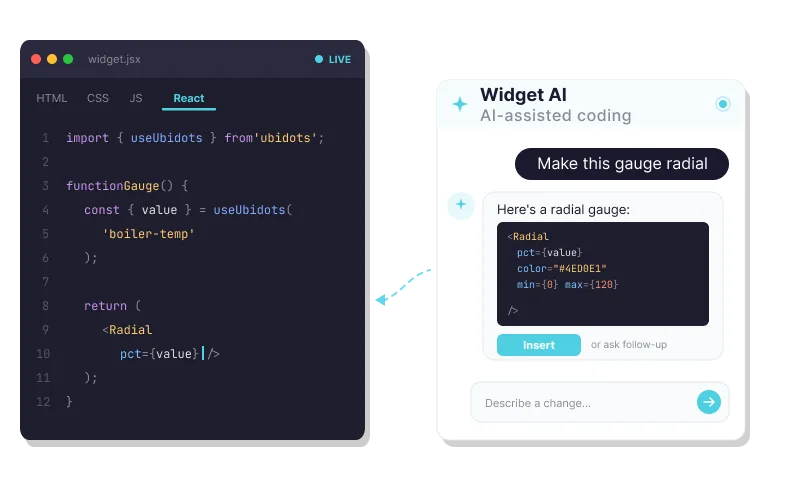
Build custom widgets with HTML, CSS, JS, or React. Extend Ubidots dashboards beyond native options using AI-assisted coding.
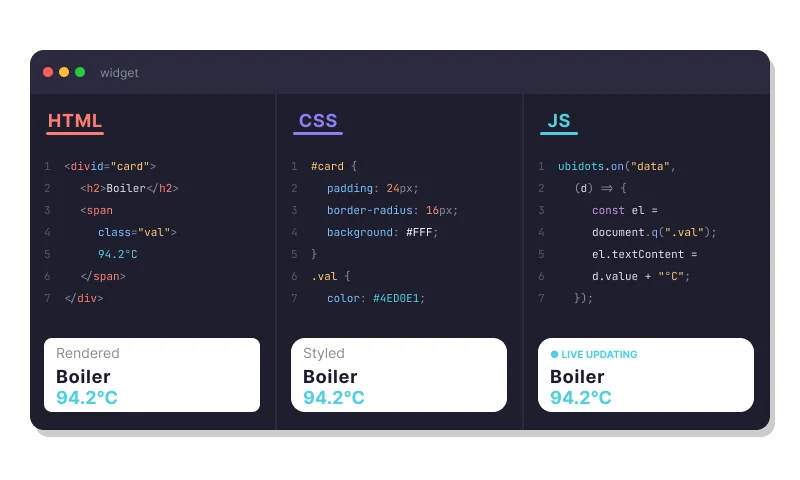
A built-in editor with dedicated tabs for each language — keeping your widget code organized without leaving the platform.
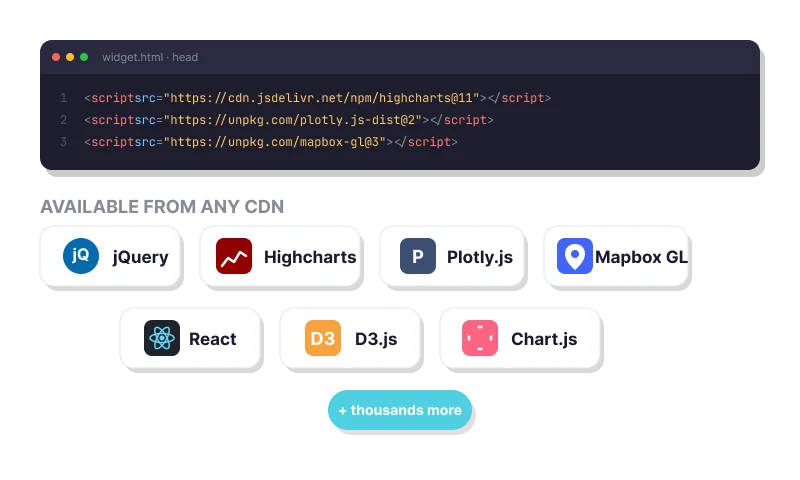
Import any CDN-hosted JavaScript library — jQuery, Highcharts, Plotly, Mapbox, React, and more.
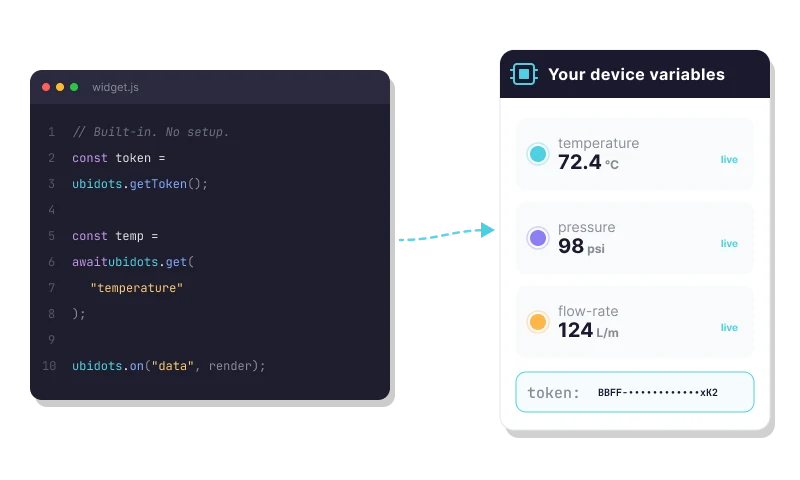
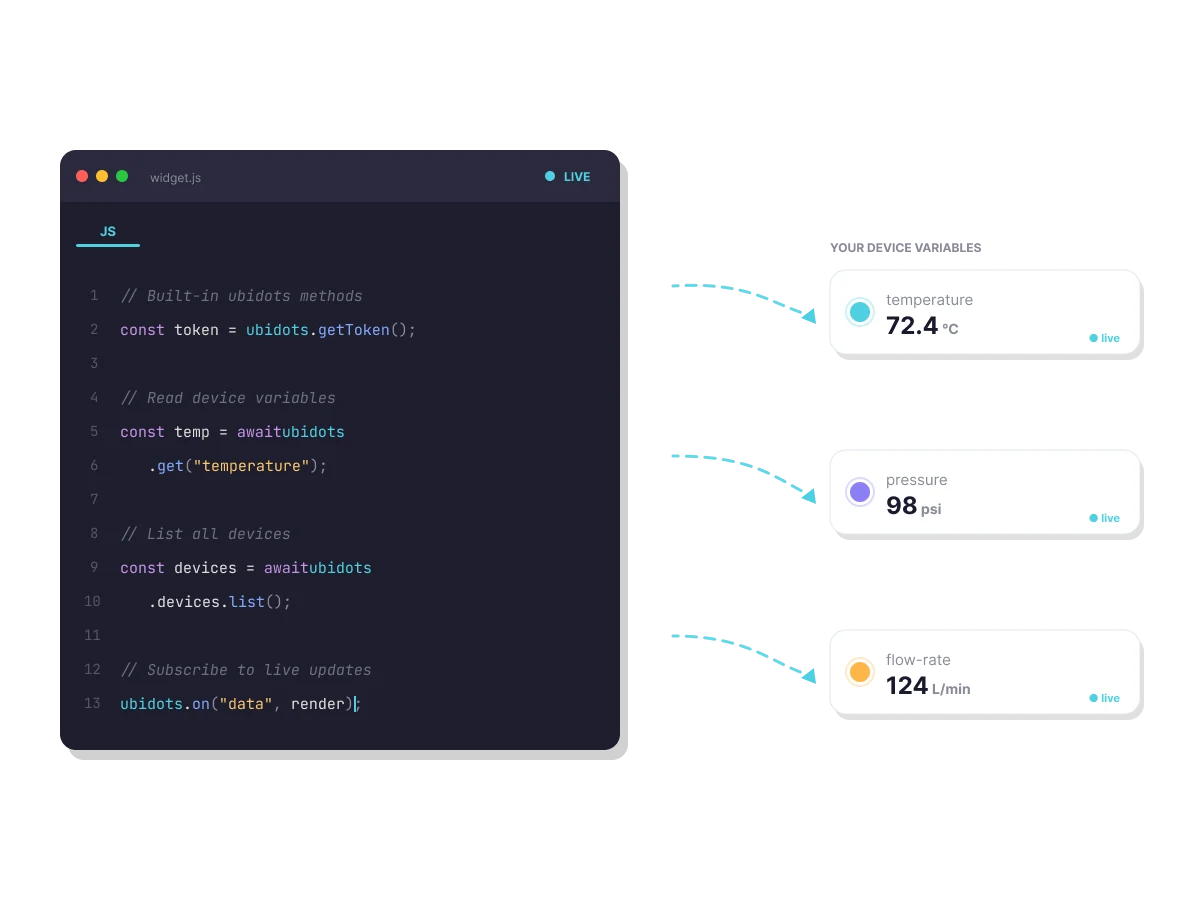
Access your Ubidots device variables and token directly from widget code using built-in methods — no extra API setup.
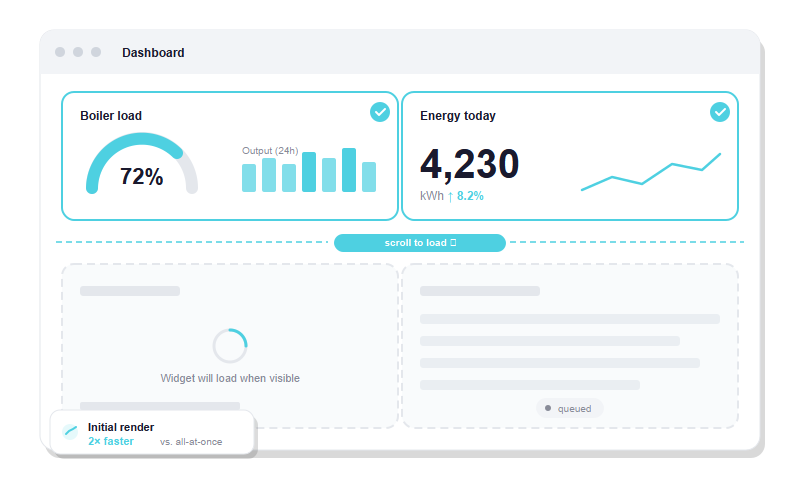
Render widgets only when they scroll into view, keeping dashboards fast even with complex custom content.
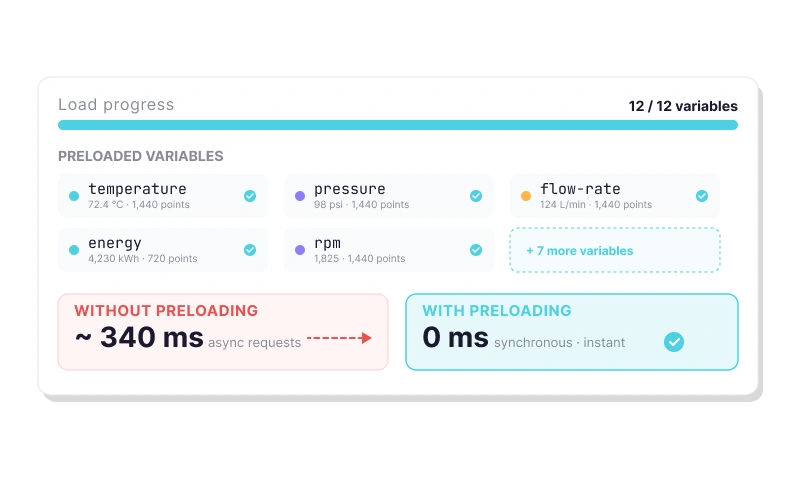
Make all dashboard data available at load time so widgets render instantly — no async callbacks required.
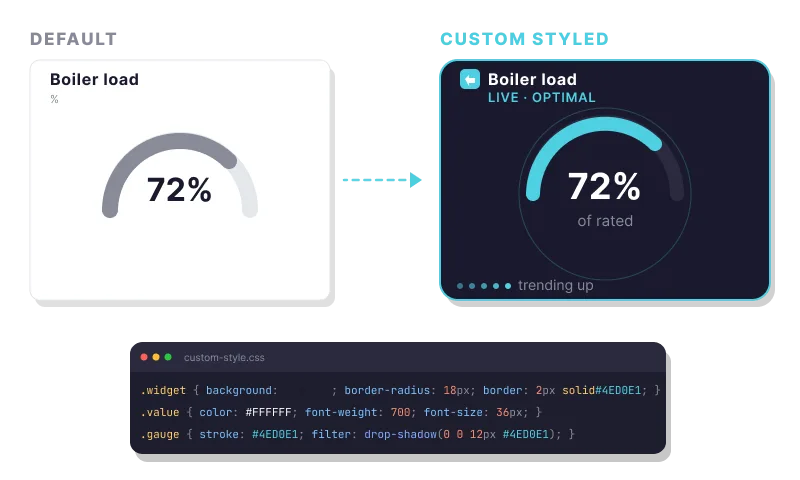
Fine-tune your widget’s appearance beyond the code editor with additional CSS through the Custom Style option.
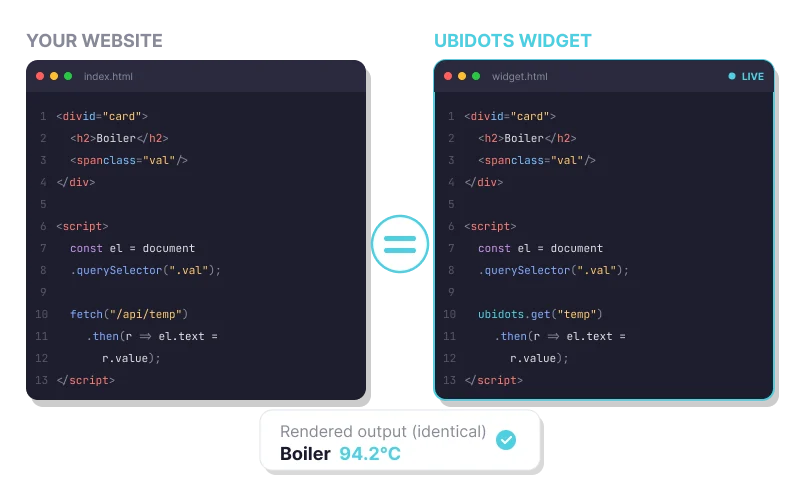
Write standard HTML, CSS, and JavaScript — the same code you’d use to build a website, with nothing new to learn.
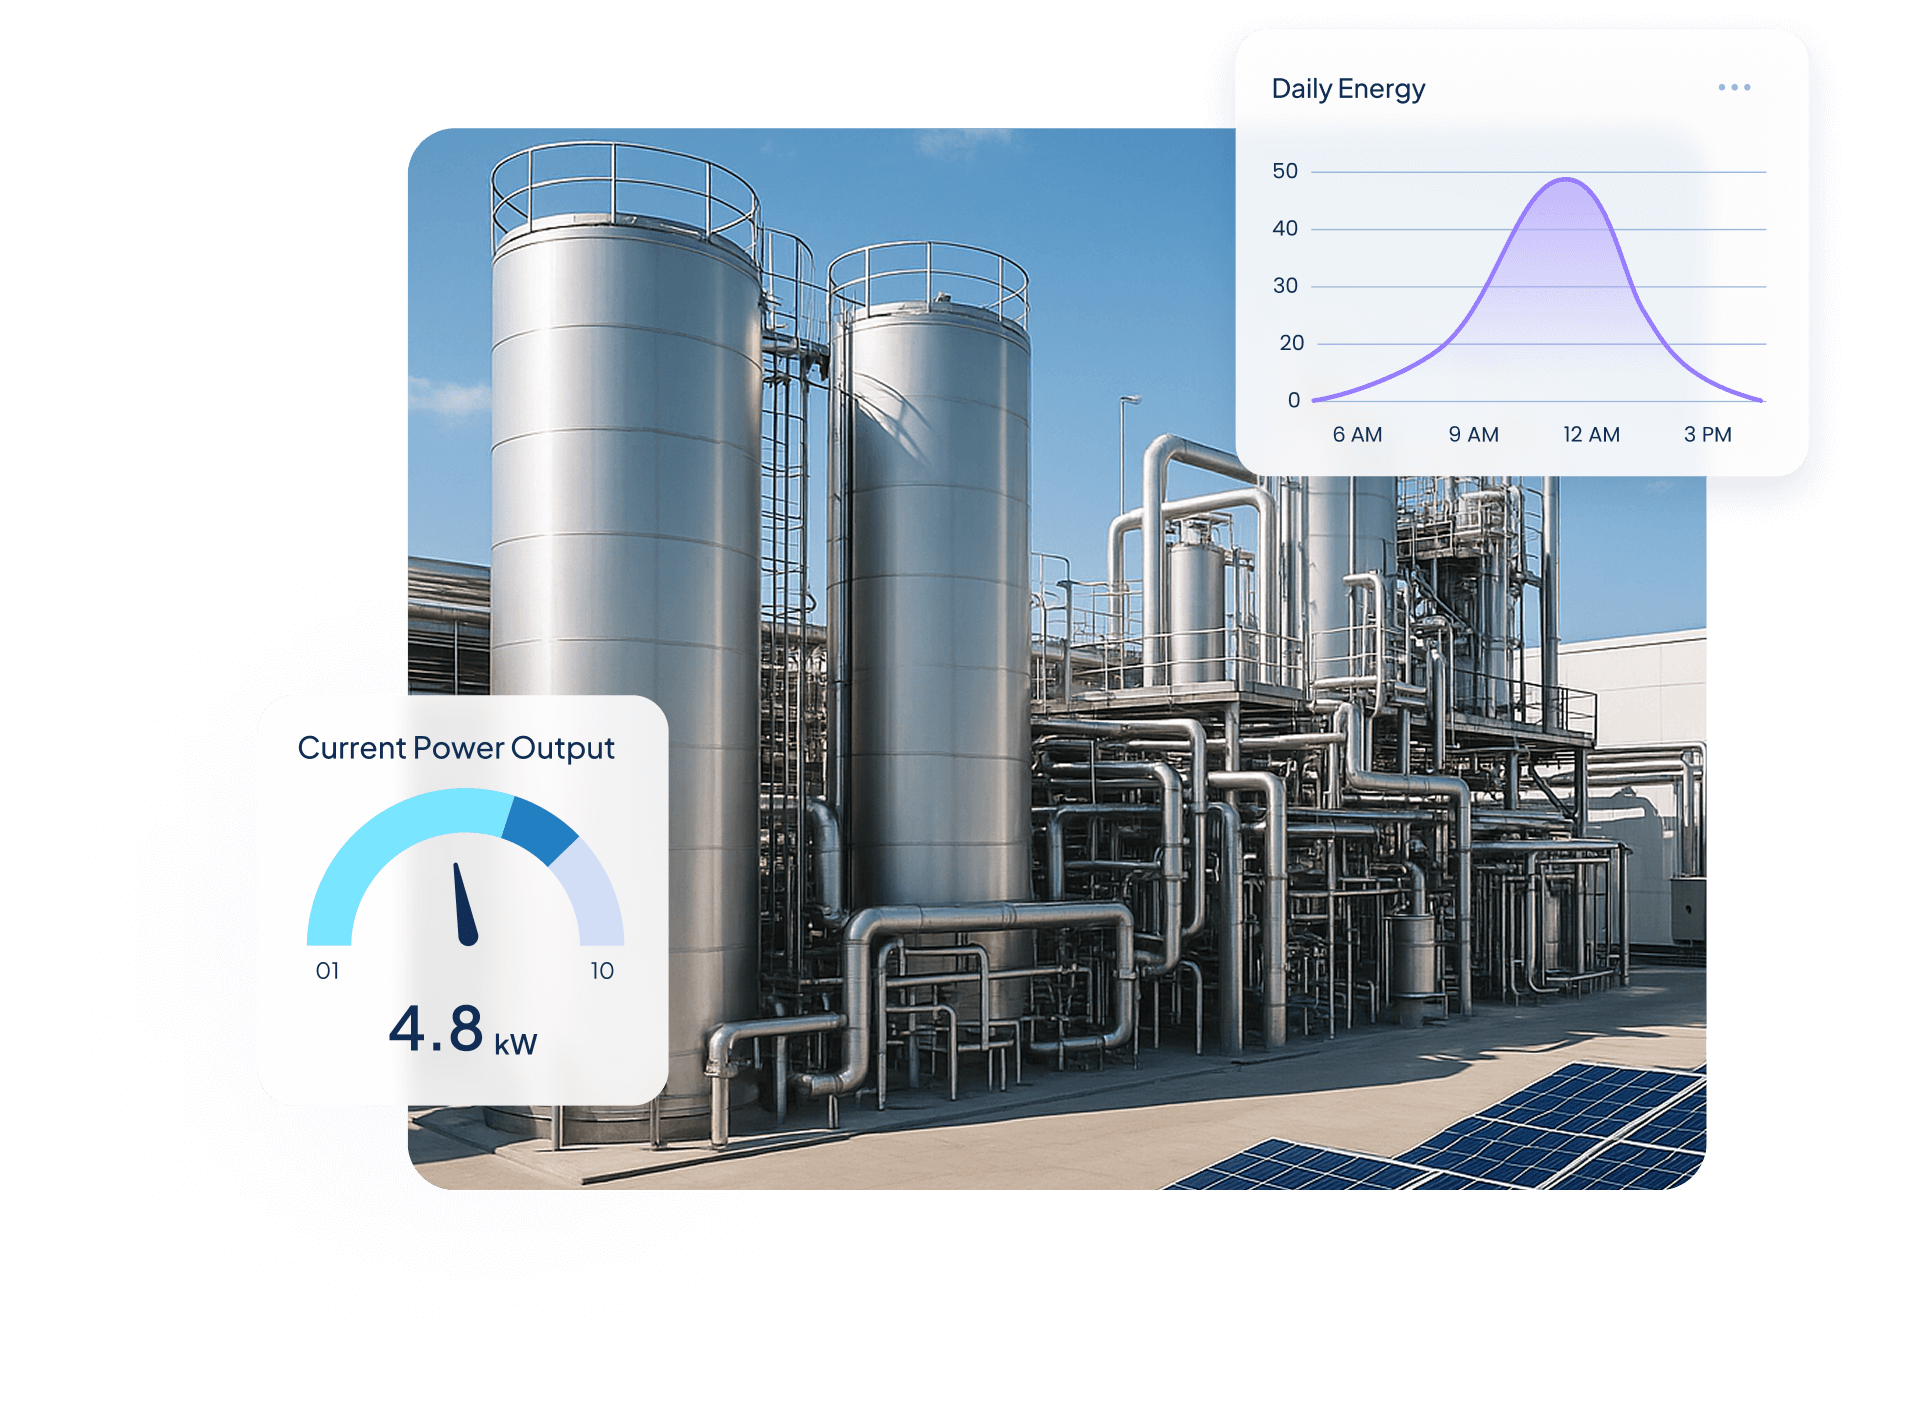
Quantify Environmental uses wireless IoT sensors and Ubidots dashboards to turn utility data into real-time insights, helping industrial clients monitor water, energy, and gas use, detect inefficiencies, and act before costs rise.
$250,000+ in annual client savings through optimized water, electricity, and gas consumption.
Millions of liters of fresh water conserved and tons of CO₂ emissions prevented driving measurable sustainability outcomes.
Improved operational oversight with real-time visibility into utility usage and equipment performance.
Success Story


Use Cases


Steve Barker
Founder & CEO
Prospect Control uses Ubidots to deliver remote tank level monitoring for industrial customers, replacing complex PLC/SCADA setups with a scalable, web-based IoT solution.
Results:


Darryl Schembri
General Manager
AIS Technology uses Ubidots to monitor electricity, water, and gas consumption across multi-tenant buildings, enabling real-time visibility, automated billing, and faster response to inefficiencies.
Results:


Onofre Tamargo
CEO & Cofounder
S4IoT uses Ubidots to remotely monitor irrigation systems in urban gardens, helping clients reduce maintenance costs, prevent plant loss, and shift from manual operations to a scalable subscription-based model.
Results:


Help & Support
Have questions about Ubidots? Here are some ofthe most common queries to help you get started.
HTML Canvas is Ubidots’ developer-friendly widget that lets you write custom HTML, CSS, and JavaScript directly inside a dashboard. It’s designed for cases where standard widgets don’t meet specific functional or aesthetic requirements — letting you build custom charts, gauges, tables, animations, or any visualization your project demands, rendered live alongside your other widgets.
HTML Canvas supports standard HTML, CSS, and JavaScript — including React. You can also import CDN-hosted third-party libraries such as charting frameworks and UI toolkits directly in the widget’s settings. There is no proprietary syntax to learn; if it runs in a browser, it works inside HTML Canvas.
HTML Canvas provides built-in methods that give your code direct access to device variables and their values from within the widget editor. You can also enable the “Preload Dashboard data” option to make all dashboard variables available the moment the widget loads, eliminating the need for separate API calls or external data fetching logic.
Use HTML Canvas when a standard Ubidots widget can’t match your exact requirements — whether that’s a custom chart type, a branded display with specific styling, an interactive UI element, or a visualization that depends on logic not available in native widgets. It’s the right choice whenever the built-in library covers the data but not the presentation.