

Benefits
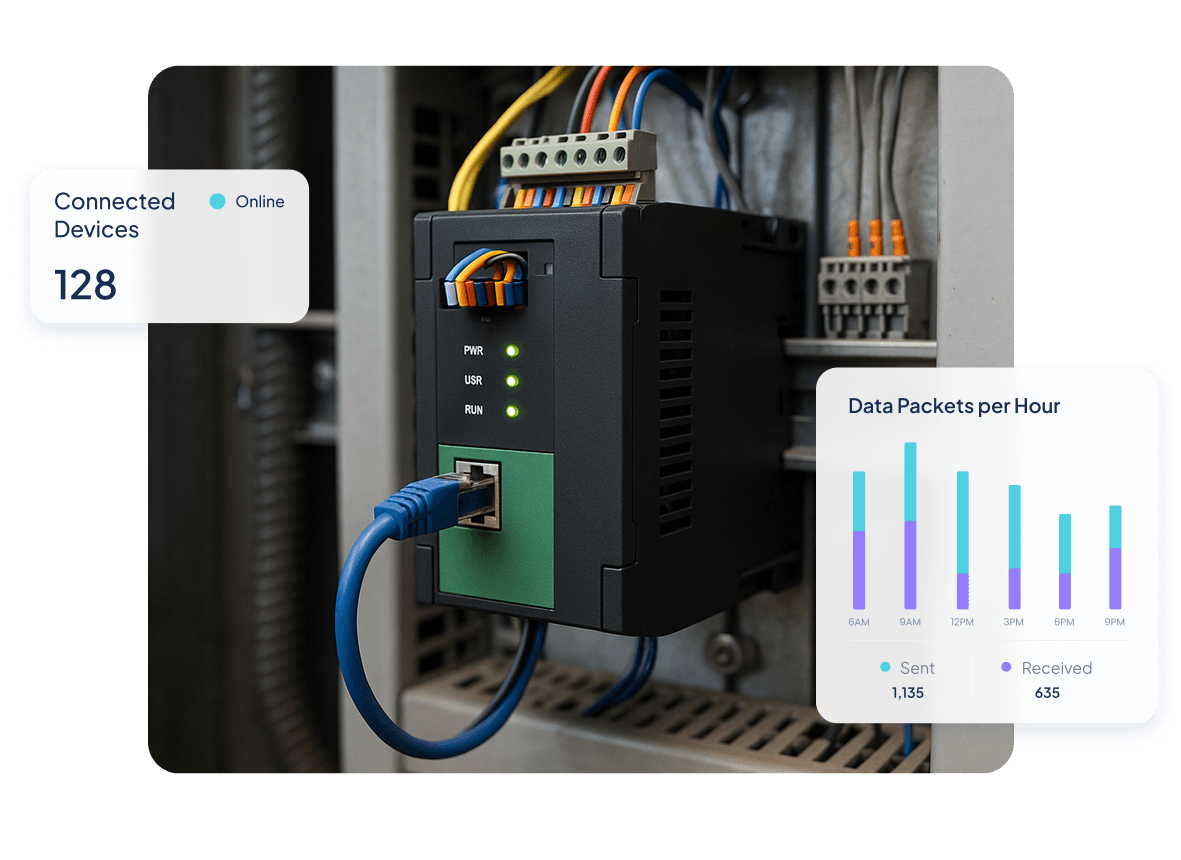
Gain instant visibility across every connected device to monitor key metrics, detect issues, and make fast, data-driven decisions.
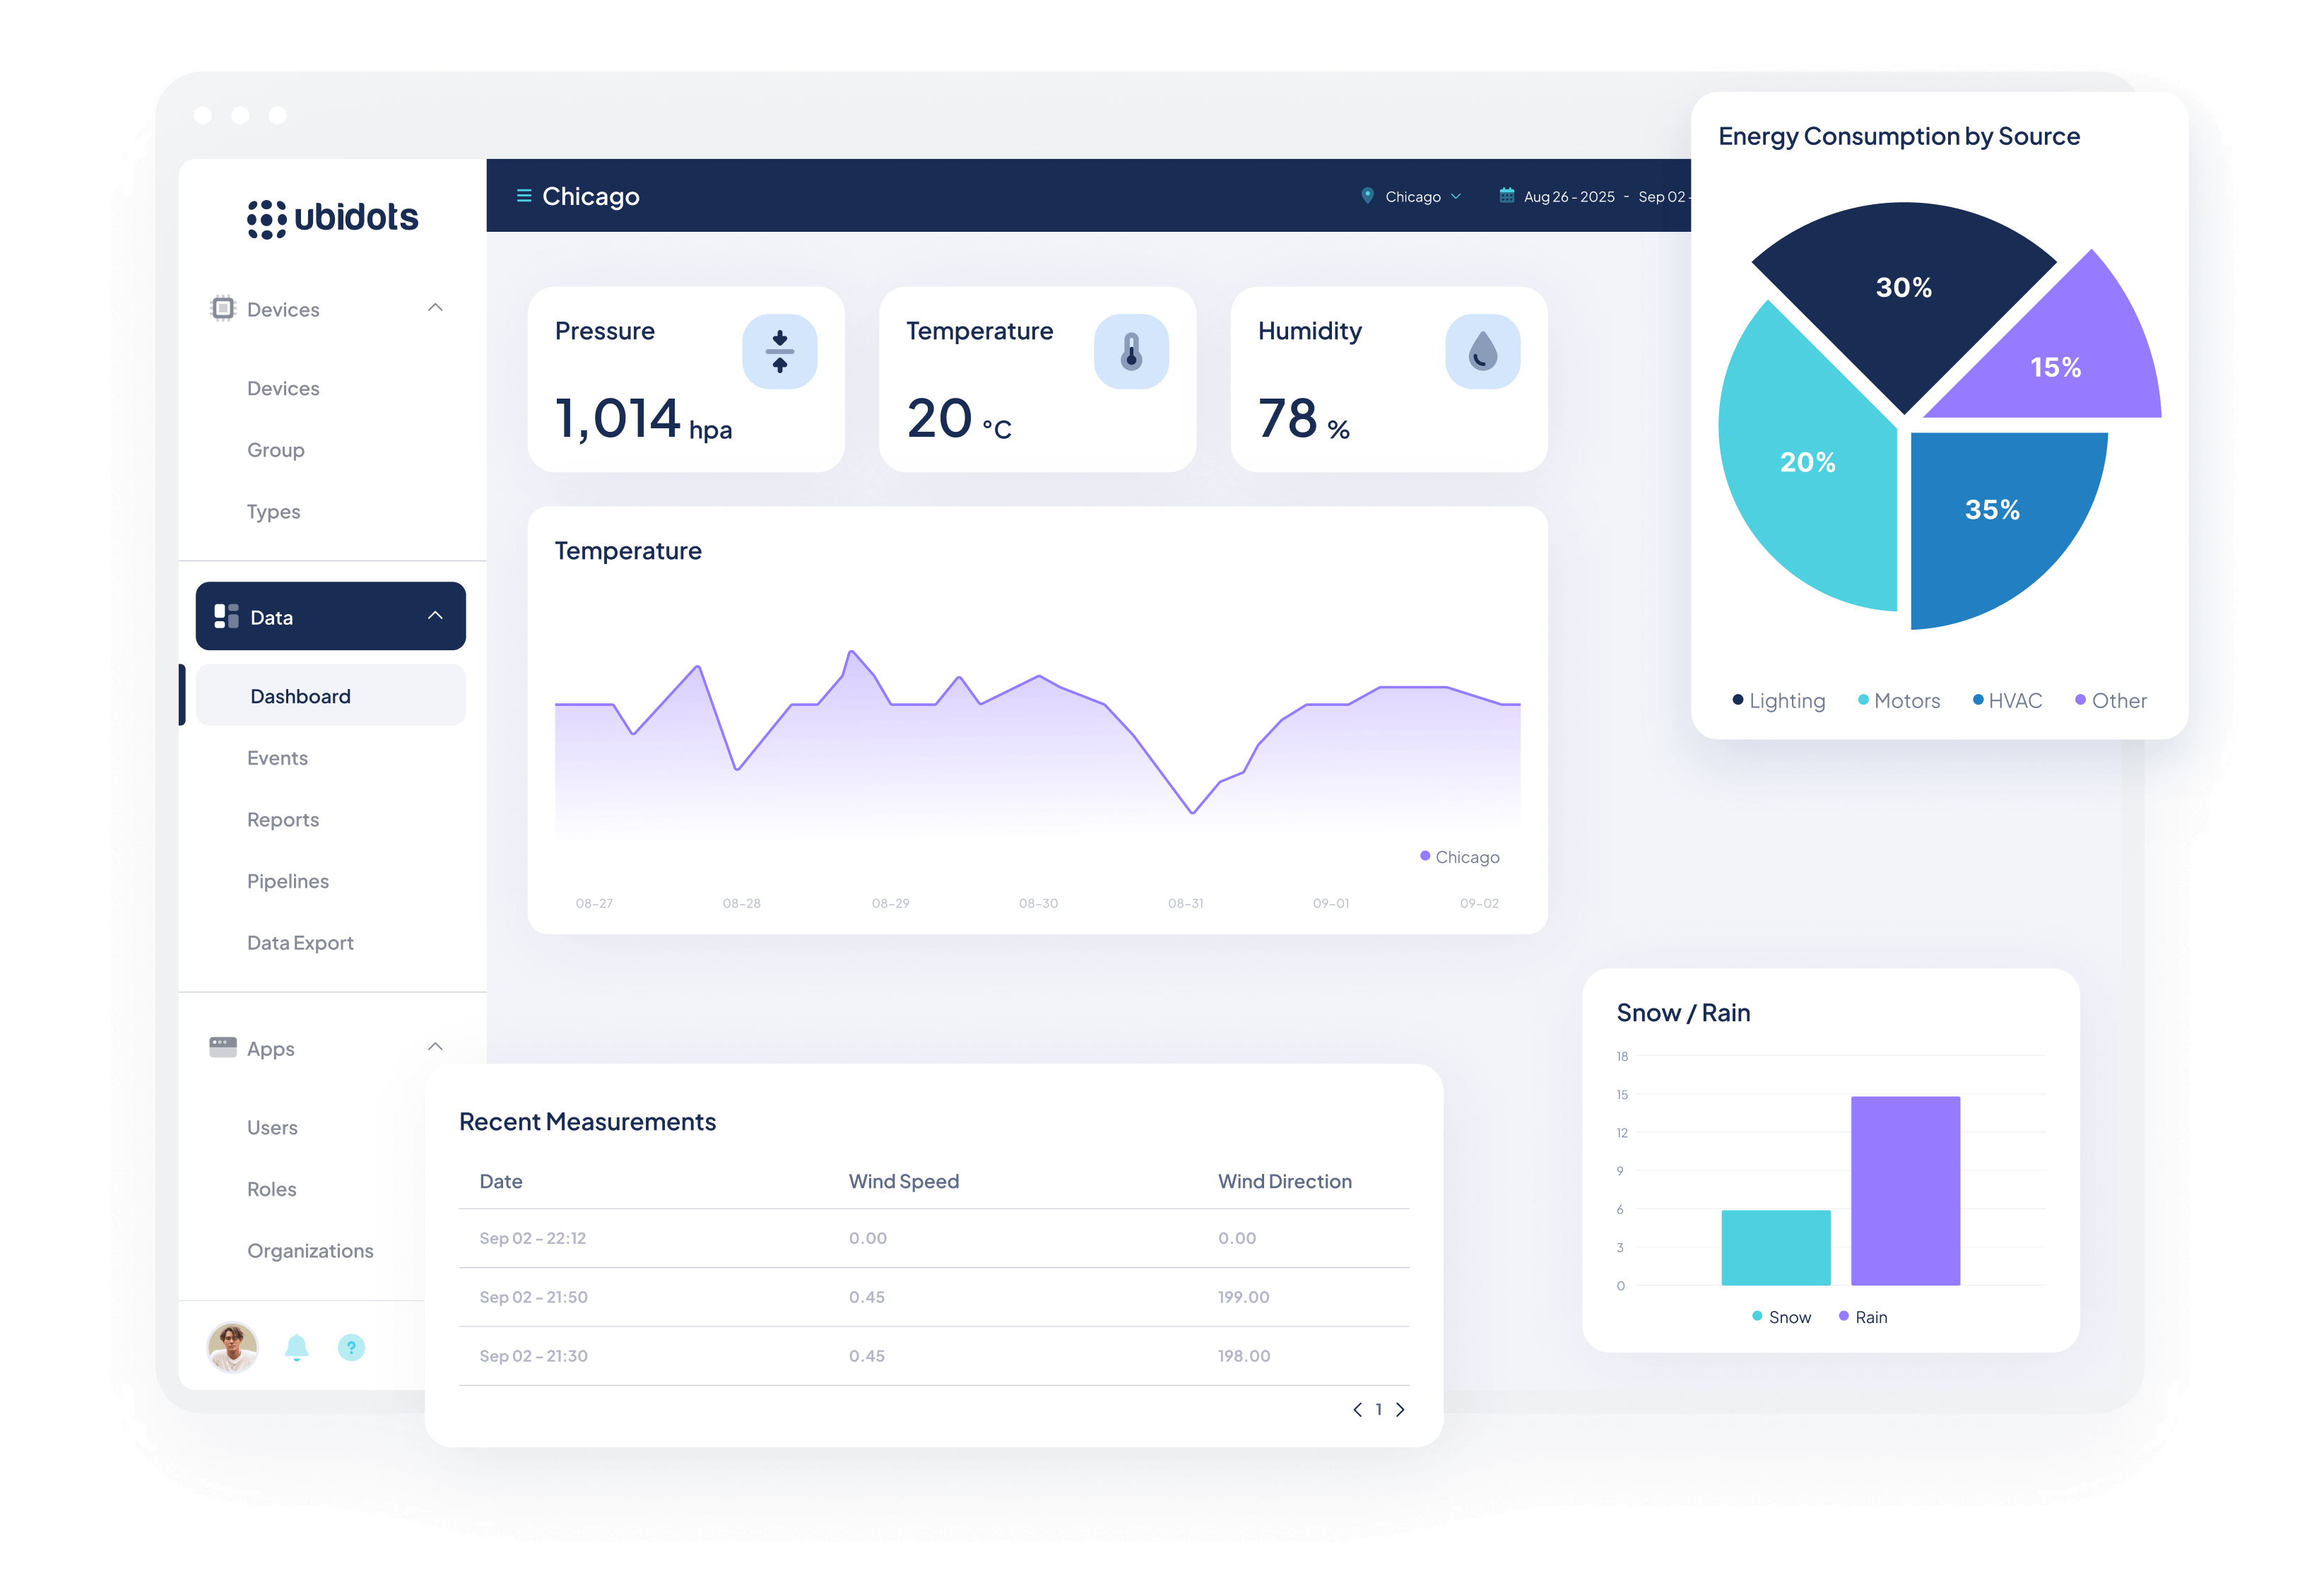
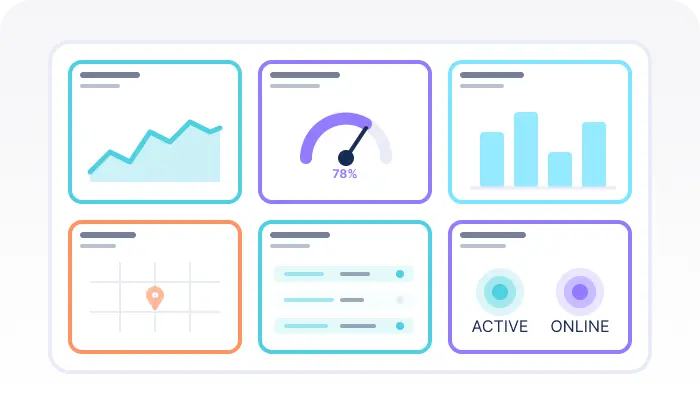
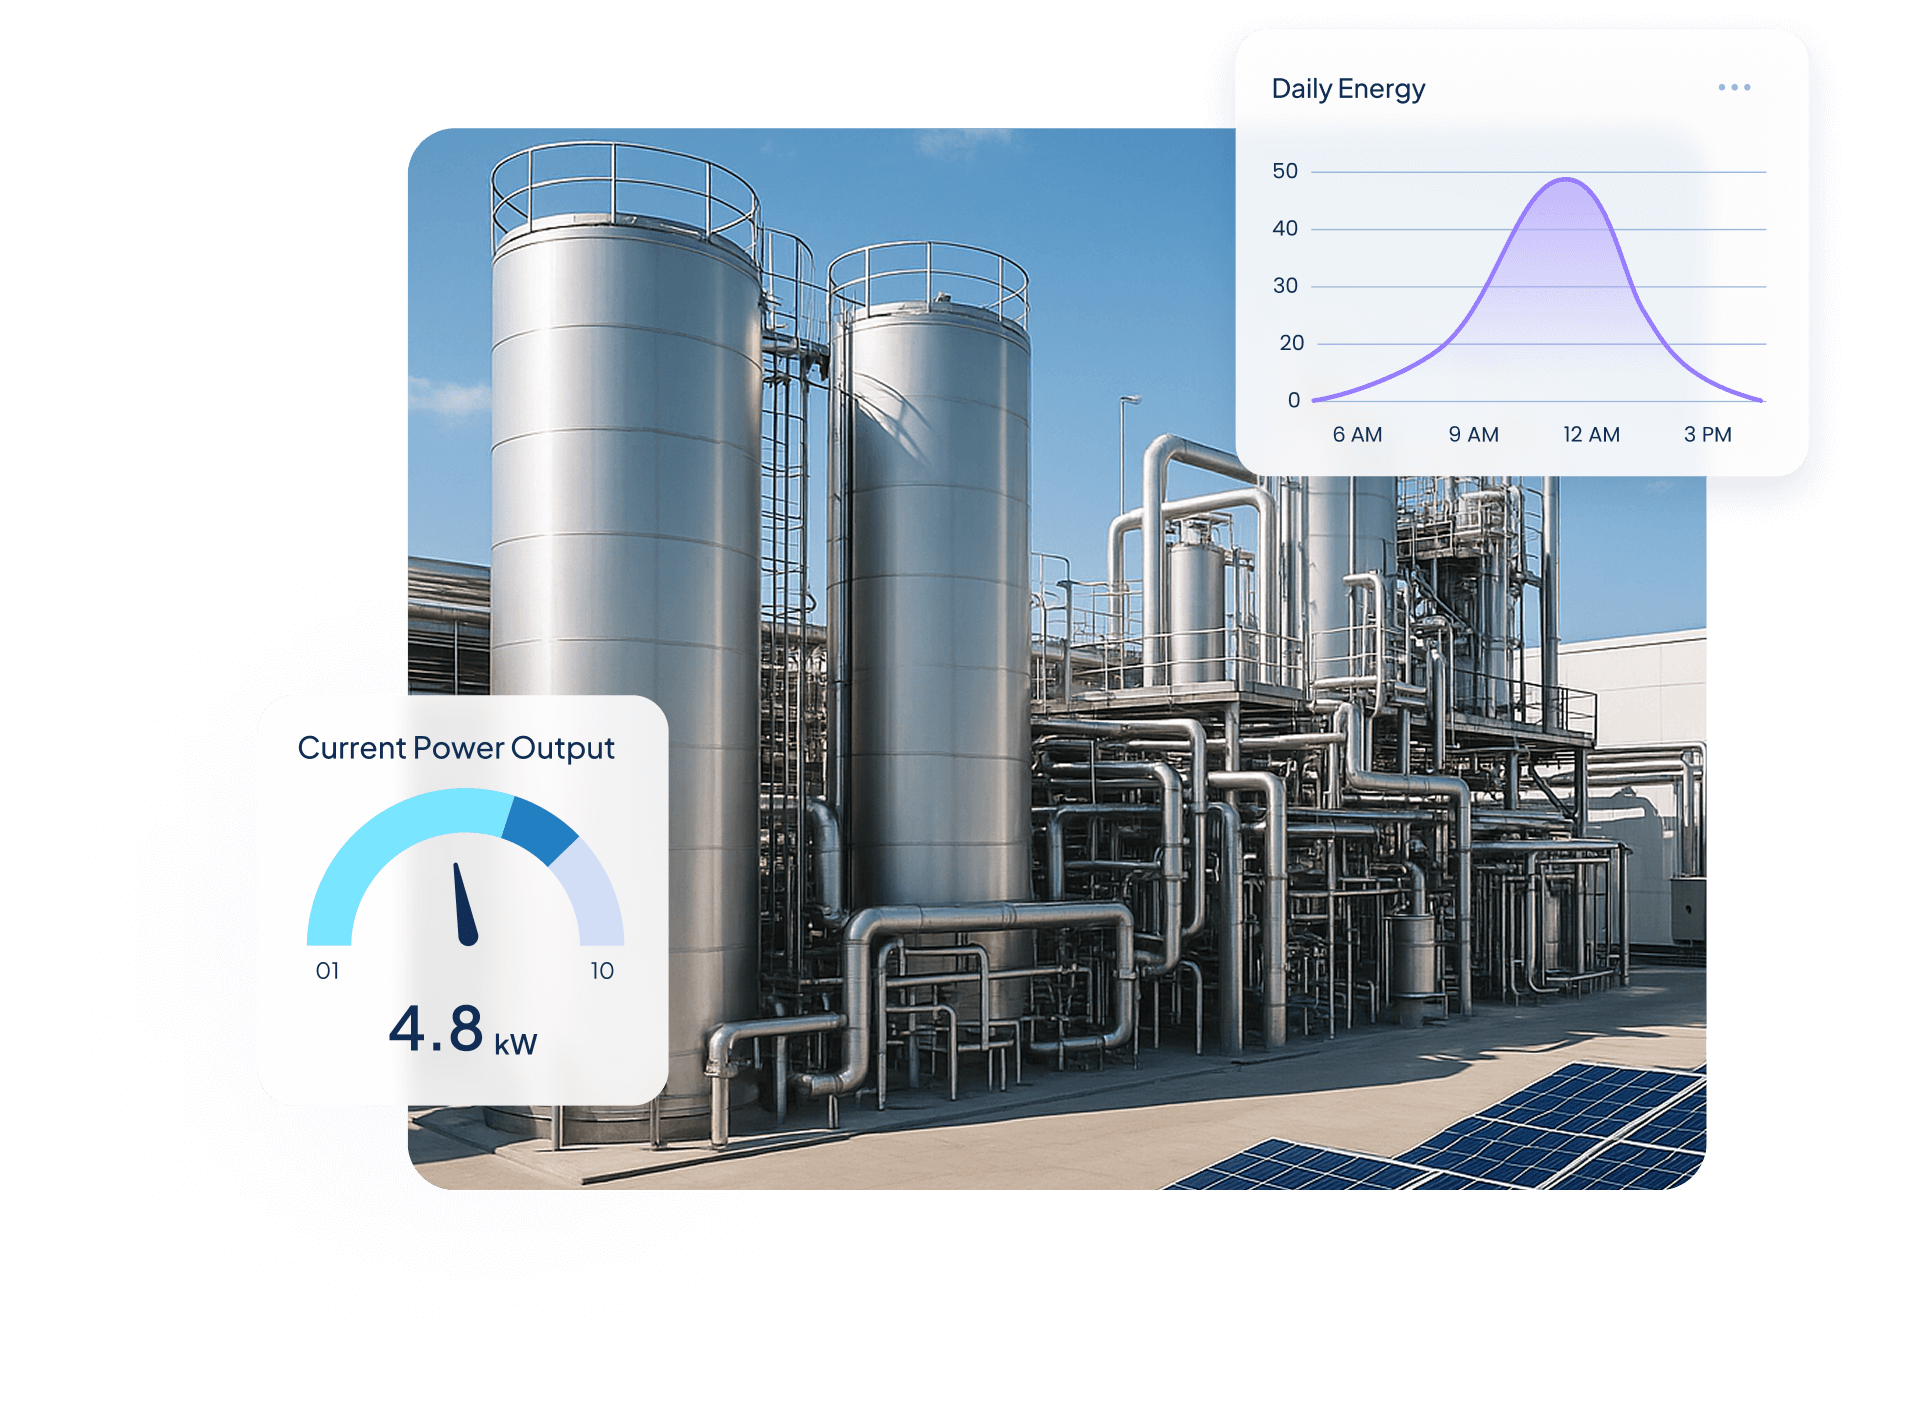
Visualize IoT data with a rich set of charts, maps, and tables—each designed to turn complex readings into clear insights.
Adapt every dashboard to your brand and workflow with flexible layouts, white-label options, and advanced editing tools.
See It in Action

How it Works
IoT dashboards turn complex machine and sensor data into clear insights, helping users monitor, analyze, and act from anywhere without local infrastructure.
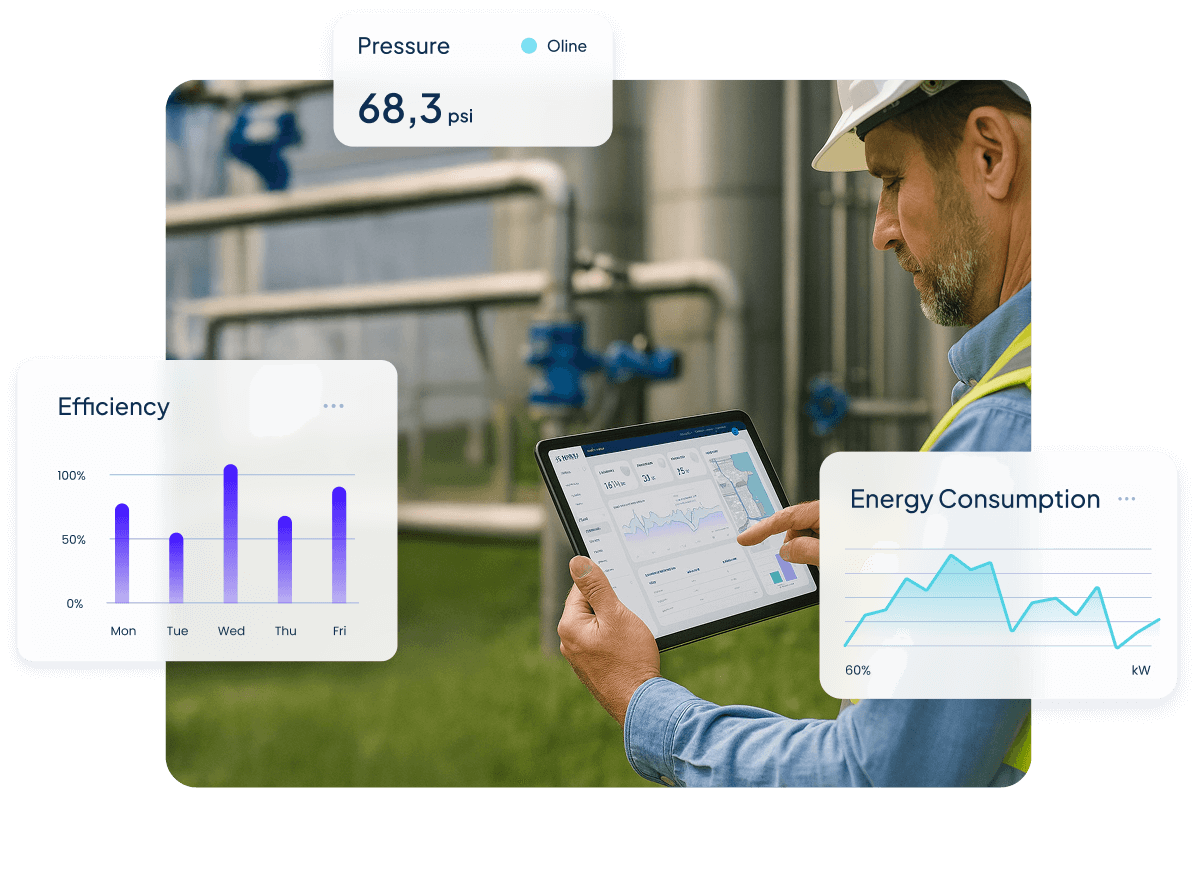
Ubidots’ IoT dashboards combine the reliability of traditional control systems with the scalability of the cloud. Designed for industrial, environmental, and smart city applications, they transform IoT data into fast, intuitive, and actionable visualizations for smarter, real-time decisions.

Key Features
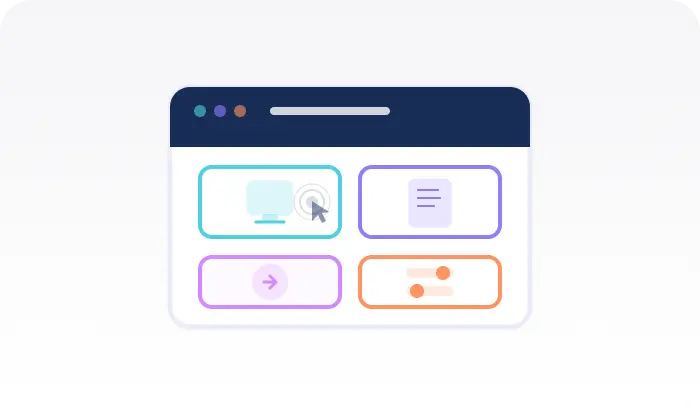
Add interactive actions like “view device” or “open page” for smoother, more intuitive navigation.
Choose from over 20 widgets to visualize and control IoT data—from simple metrics to advanced SCADA-style views.
Adjust colors, layouts, and widgets to match your brand. Create dashboards that look and feel uniquely yours.
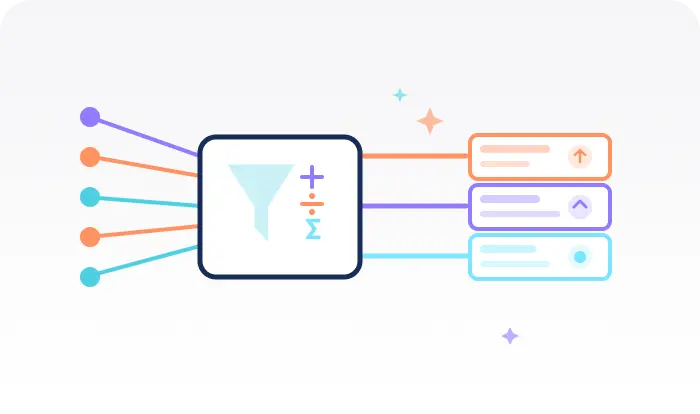
Filter, group, and calculate IoT data to reveal key insights. Focus on metrics that drive performance.
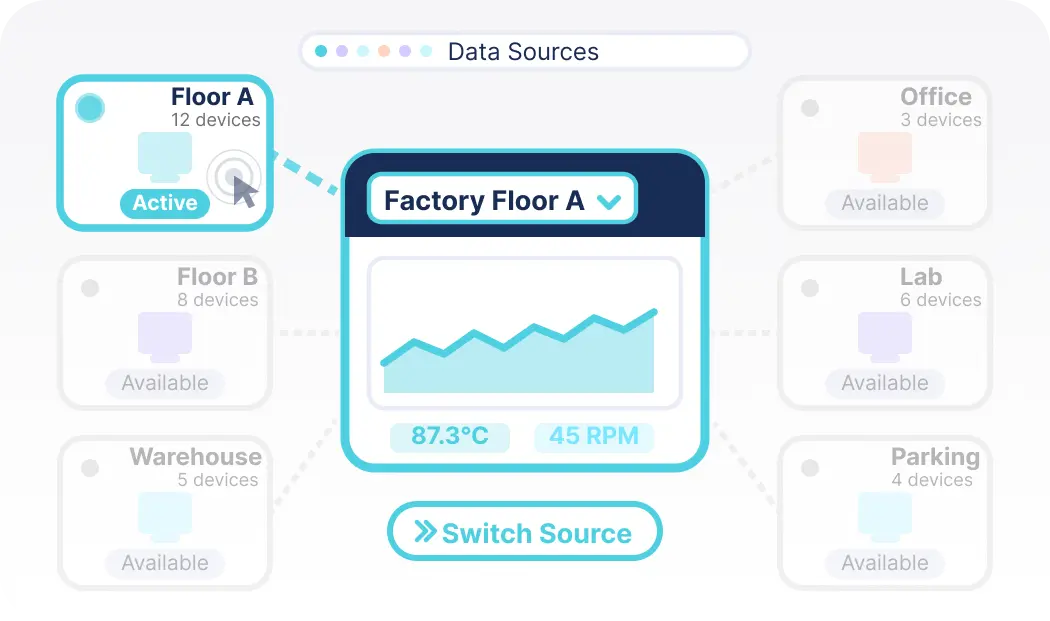
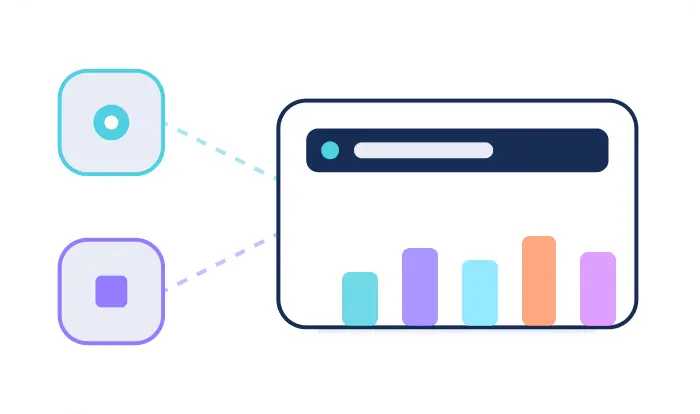
Dashboards adapt as your data changes. Instantly switch devices or merge data streams in real time.
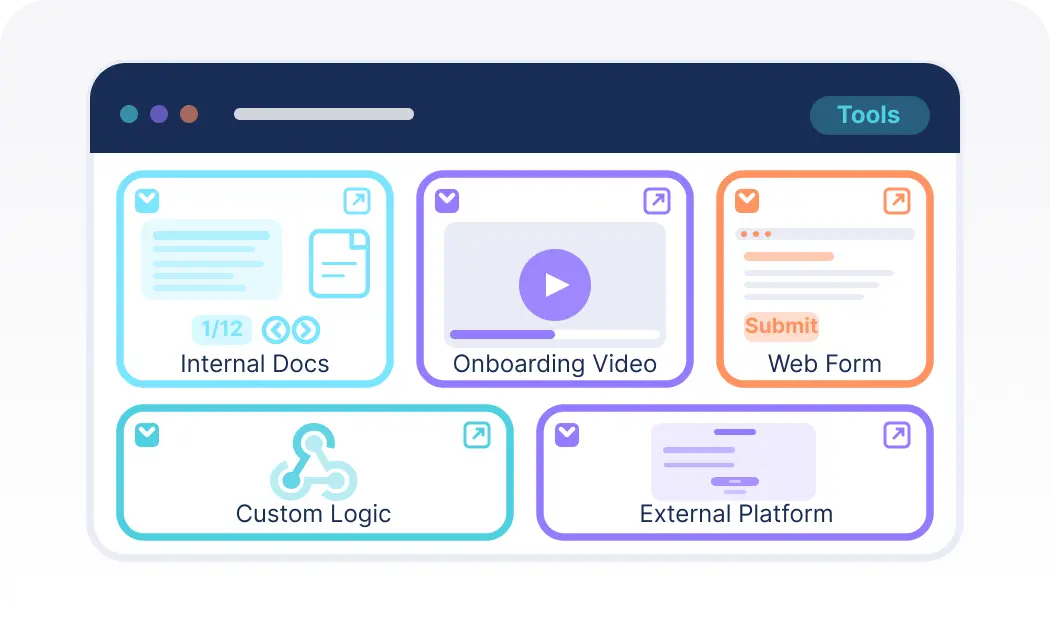
Embed web tools or share dashboards publicly. Combine IoT data with external sources and collaborate across teams.
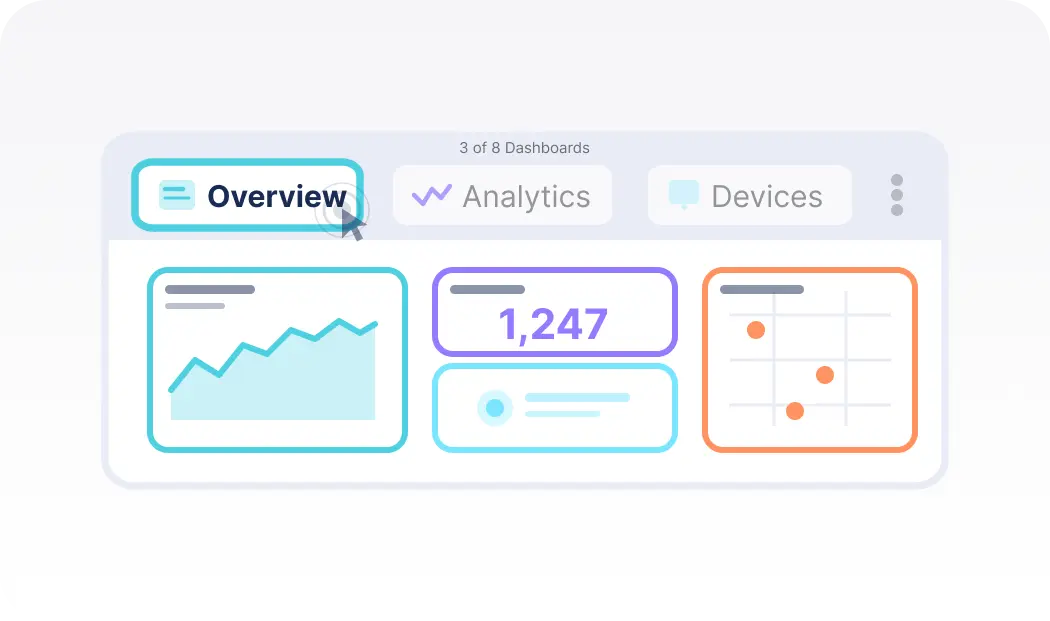
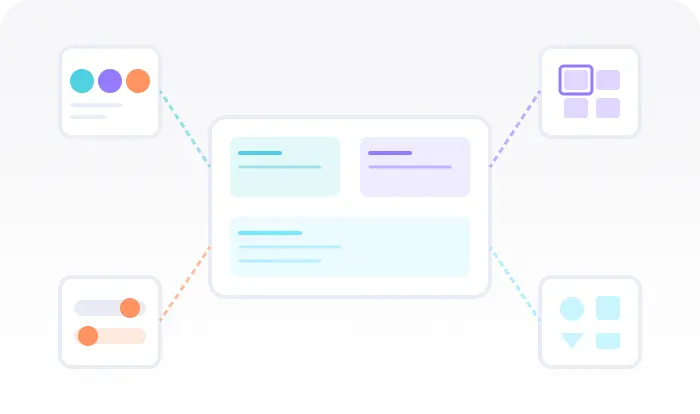
Organize dashboards in tabs to connect key operations. Switch views or external pages instantly and keep all insights in one workspace.
Visualize and compare multiple devices in one place. Detect patterns and monitor performance across your entire system.
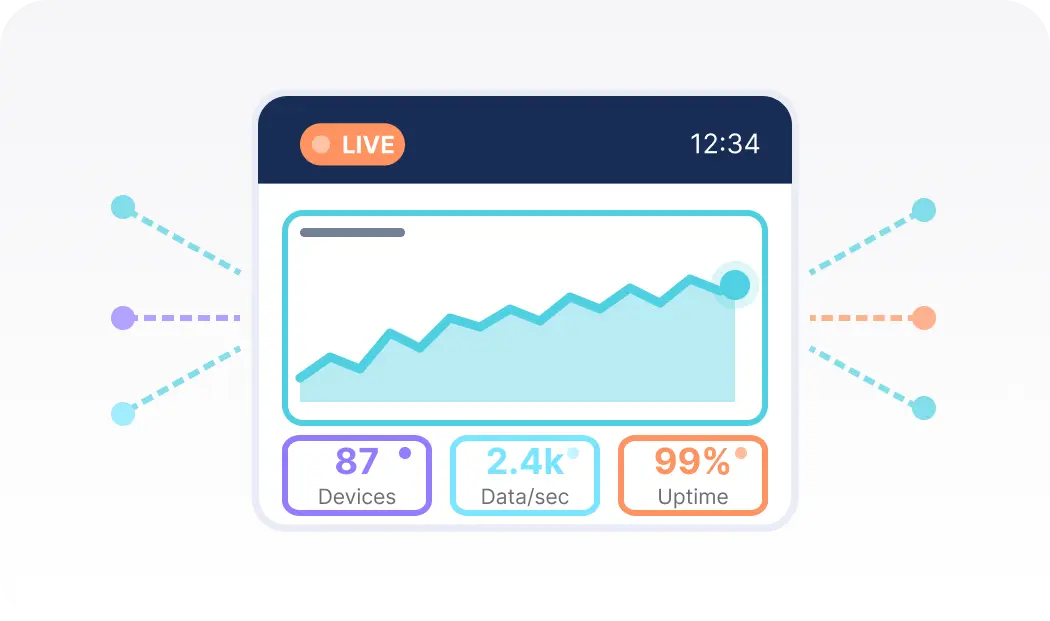
See IoT data update instantly. Track live operations or pause to analyze, ensuring full visibility and control.
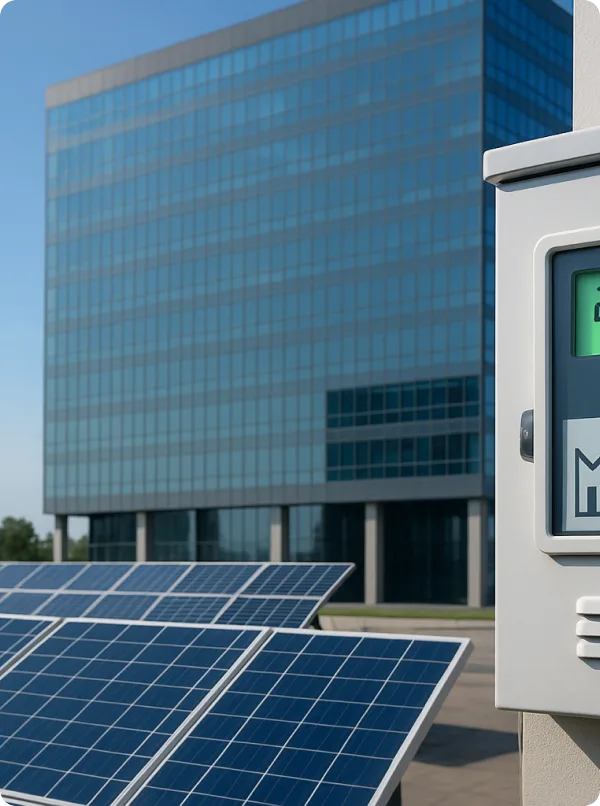
Quantify Environmental uses wireless IoT sensors and Ubidots dashboards to turn utility data into real-time insights, helping industrial clients monitor water, energy, and gas use, detect inefficiencies, and act before costs rise.
$250,000+ in annual client savings through optimized water, electricity, and gas consumption.
Millions of liters of fresh water conserved and tons of CO₂ emissions prevented driving measurable sustainability outcomes.
Improved operational oversight with real-time visibility into utility usage and equipment performance.
Success Story


Use Cases


Steve Barker
Founder & CEO
Prospect Control uses Ubidots to deliver remote tank level monitoring for industrial customers, replacing complex PLC/SCADA setups with a scalable, web-based IoT solution.
Results:

Darryl Schembri
General Manager
AIS Technology uses Ubidots to monitor electricity, water, and gas consumption across multi-tenant buildings, enabling real-time visibility, automated billing, and faster response to inefficiencies.
Results:

Onofre Tamargo
CEO & Cofounder
S4IoT uses Ubidots to remotely monitor irrigation systems in urban gardens, helping clients reduce maintenance costs, prevent plant loss, and shift from manual operations to a scalable subscription-based model.
Results:


Help & Support
Have questions about Ubidots? Here are some ofthe most common queries to help you get started.
Ubidots offers over 20 ready-to-use widget types — including line charts, bar charts, gauges, maps, tables, metric displays, and SCADA-style controls. Each widget connects directly to your device data and updates in real time, letting you build operational dashboards that match your exact monitoring needs without writing any code.
Yes. Ubidots provides a fully codeless dashboard builder designed for both technical and non-technical users. You can drag and drop widgets, configure data sources, set custom layouts, and apply your brand's colors and styles — all from a visual interface. For advanced use cases, an HTML Canvas widget lets developers add custom JavaScript, CSS, or React-based visualizations.
Yes. Ubidots dashboards display live sensor data as it arrives, with instant updates across all connected widgets. You can monitor multiple devices simultaneously in a single dashboard — comparing readings side by side, aggregating values across a fleet, or switching between devices dynamically using built-in device selectors and filters.
Absolutely. Ubidots supports full white-labeling — you can apply your own logo, color palette, custom domain, and CSS styles so your clients see your brand, not Ubidots. Combined with role-based access and multi-tenant organizations, you can deliver a tailored, branded dashboard experience to each client from a single platform.