

Benefits
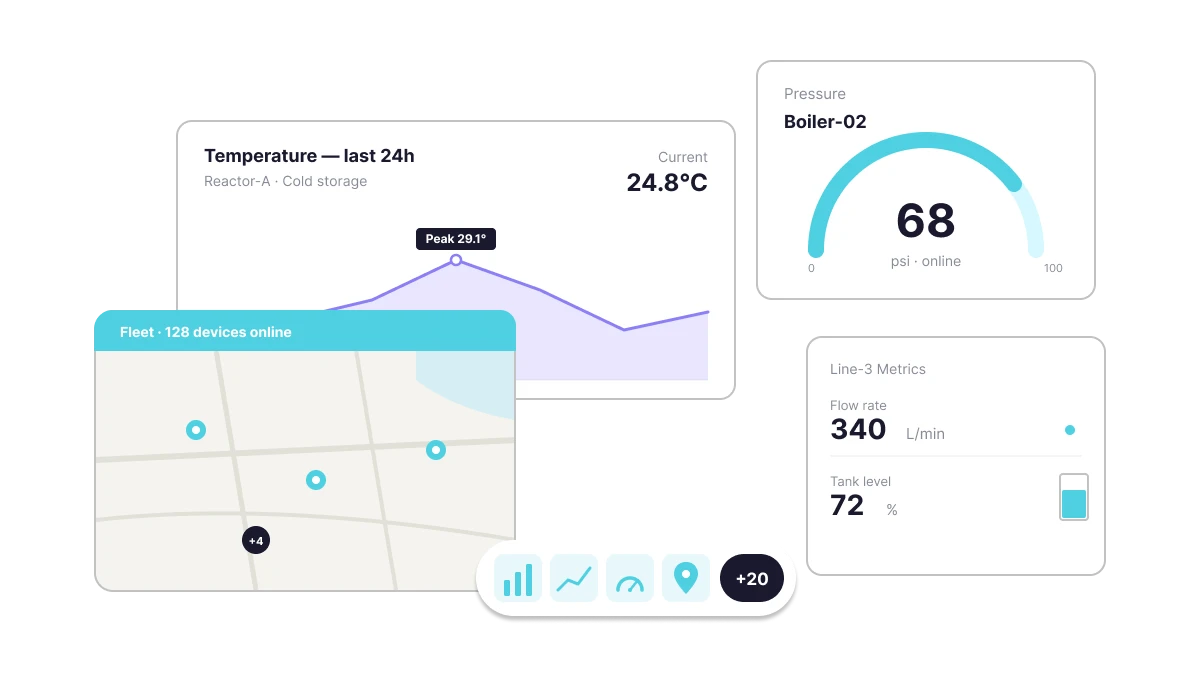
From gauges and line charts to maps and SCADA views, every measurement has a purpose-built display.
Widgets refresh automatically as new data arrives — no manual reload, no stale readings.
Display data from a single device or aggregate across your entire fleet in one widget.
Drag, resize, and arrange widgets freely on the canvas to match your operational workflow.
Set value-based color changes to instantly flag normal, warning, and critical states.
Publish dashboards publicly or embed individual widgets in external sites and customer portals.
See It in Action

How it Works
Ubidots ships 20+ widget types covering every visualization need — from simple number displays to interactive maps and industrial SCADA diagrams. Each widget is configured directly in the browser and live the moment you save.
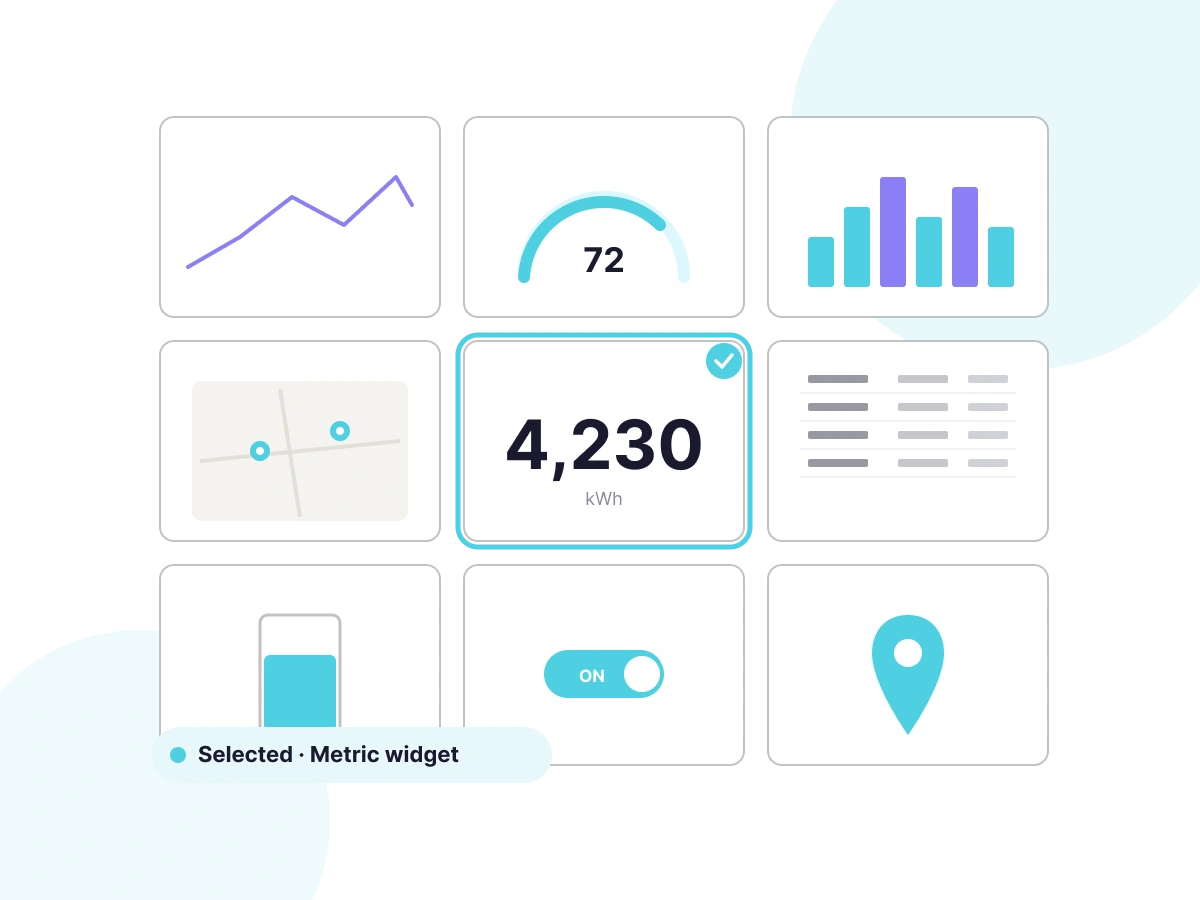
Browse metric, chart, map, table, and control widgets. Each type is optimized for a specific kind of data — select the one that matches what your sensor measures and how your users need to read it.
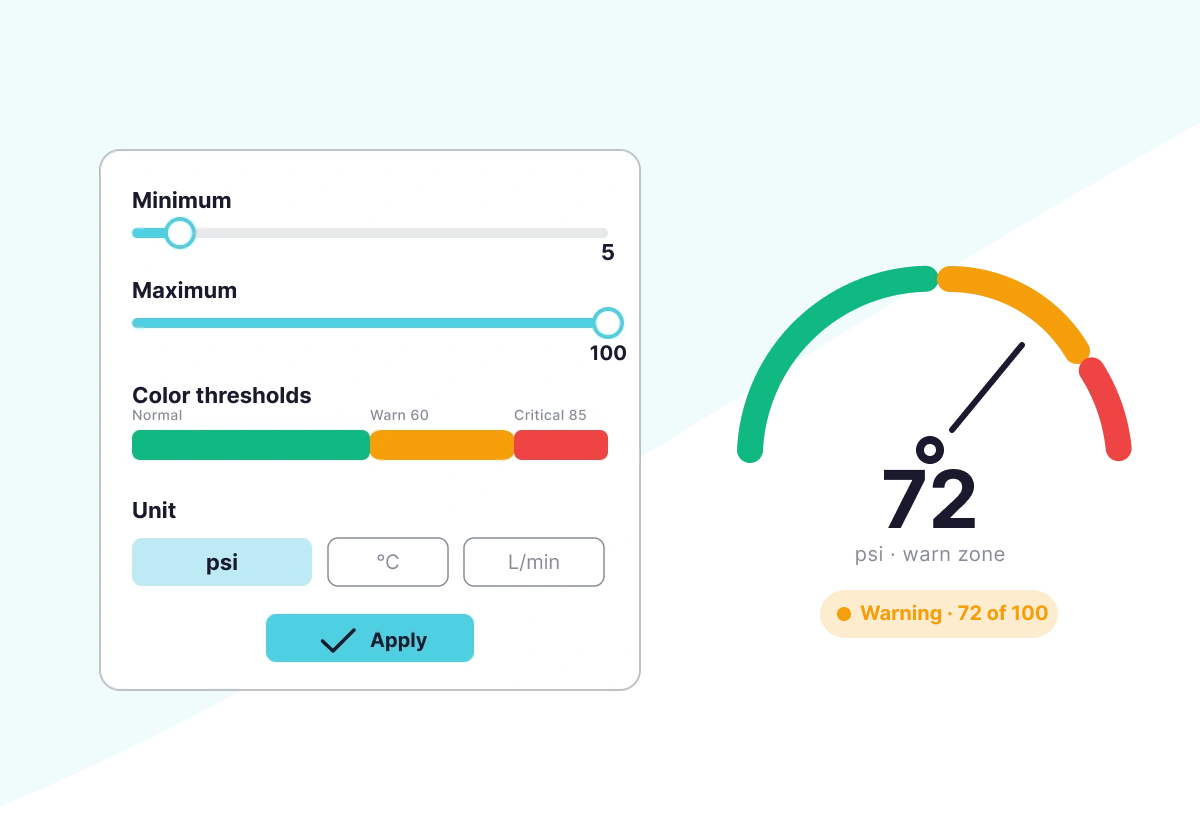
Configure minimum and maximum values, color-coded thresholds, and conditional labels without writing code. Your widget communicates status — not just numbers.
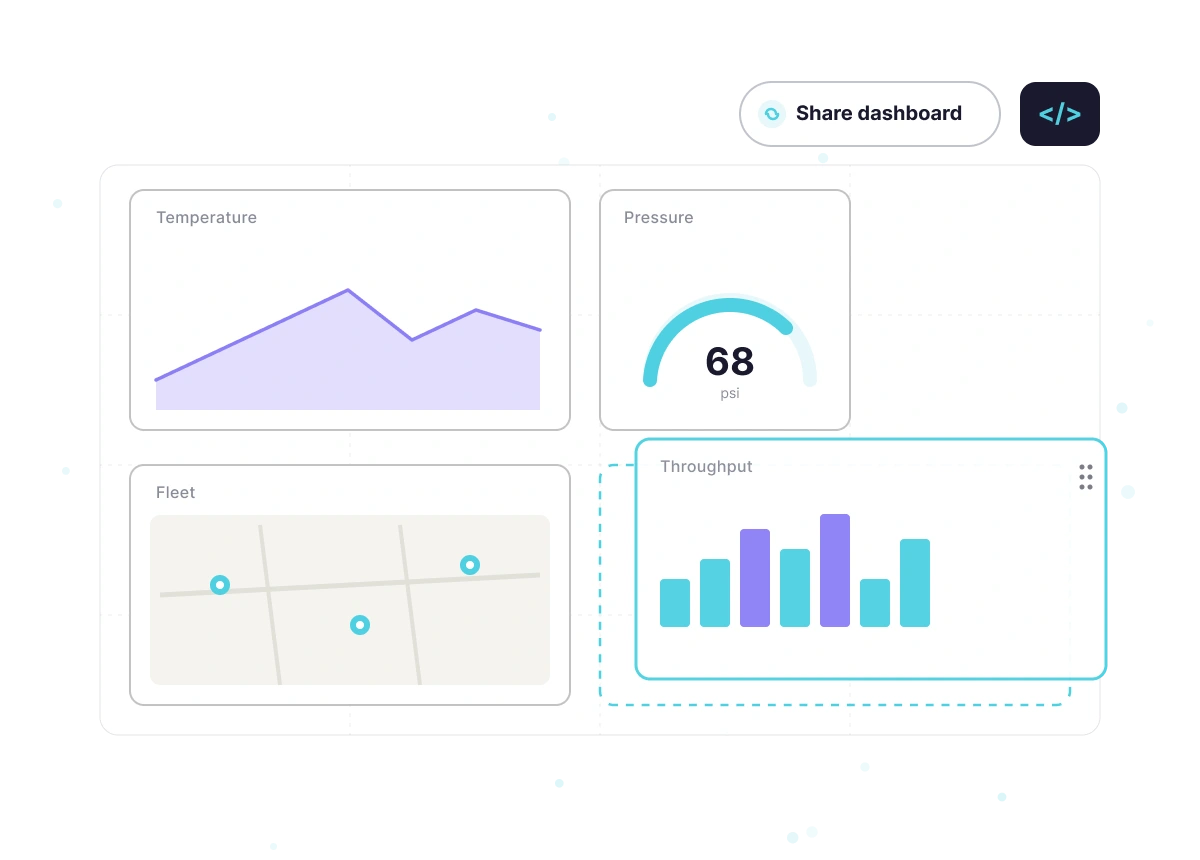
Configure each widget's data source, display settings, and thresholds, then drag it into position on the dashboard canvas and resize it to fit your layout. Share the finished dashboard via link, restrict access by role, or embed it in your own application.

Key Features

Plot one or more variables over time to spot trends and compare historical performance.
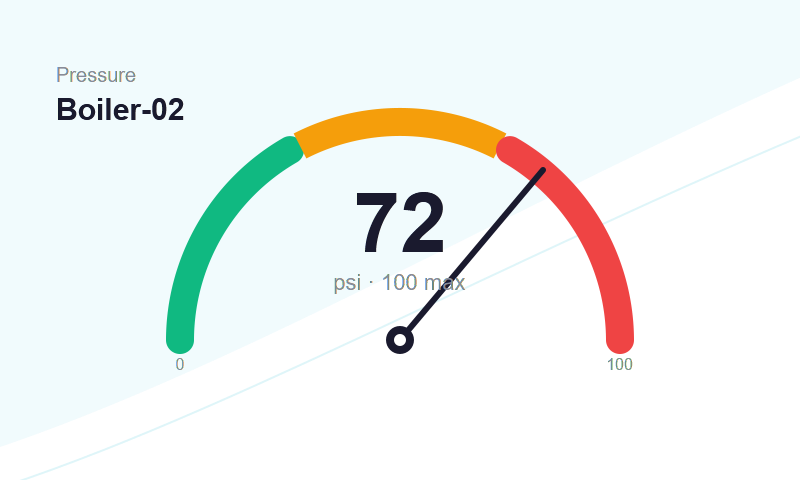
Display a live value within a defined range with configurable min, max, and threshold zones.
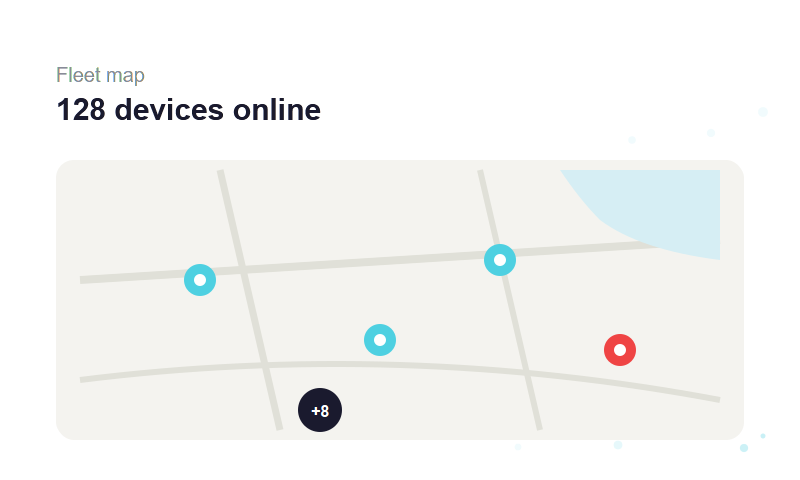
Show device locations on an interactive map with real-time status indicators per device.
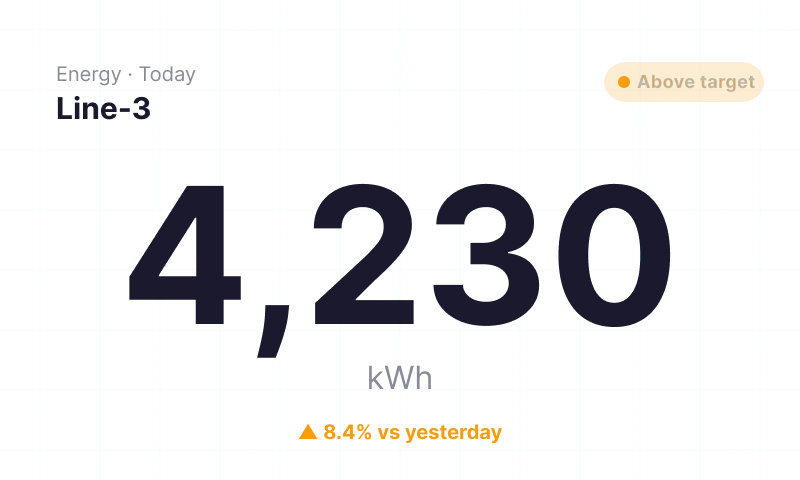
Show a single large-format value with unit, label, and conditional color formatting.
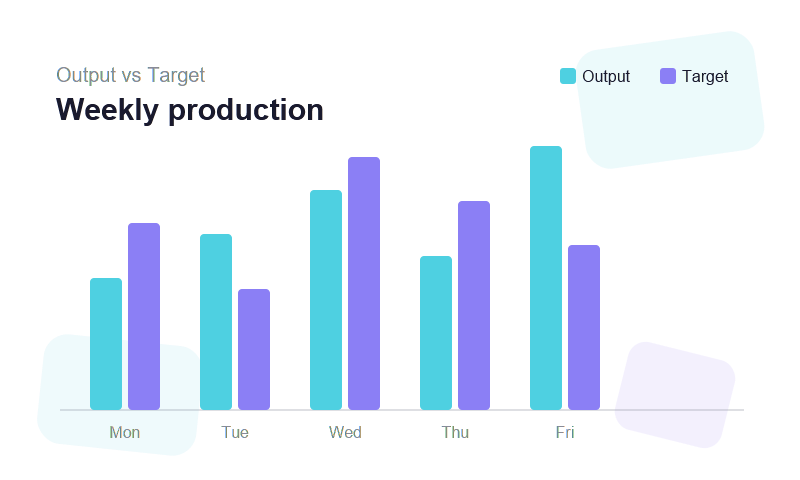
Compare values across devices, time periods, or categories with grouped or stacked bars.

Display raw or aggregated variable data in rows and columns for detailed inspection.

Send commands back to devices directly from the dashboard using interactive control widgets.
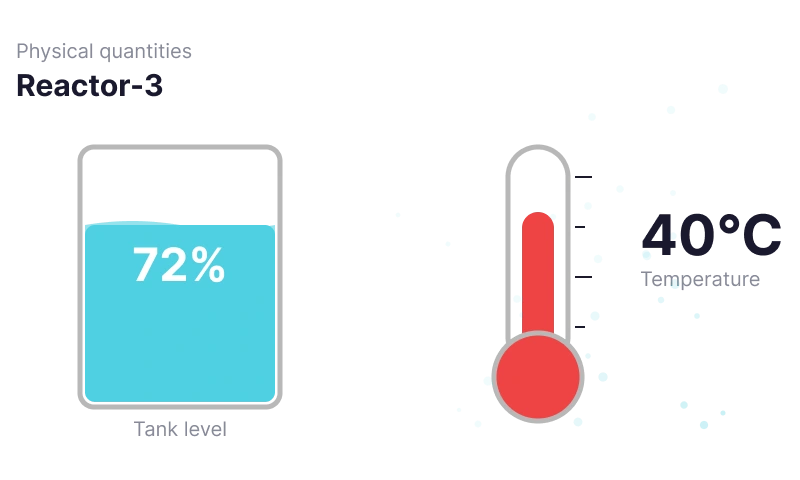
Visualize physical quantities like fluid levels and temperatures in intuitive real-world formats.
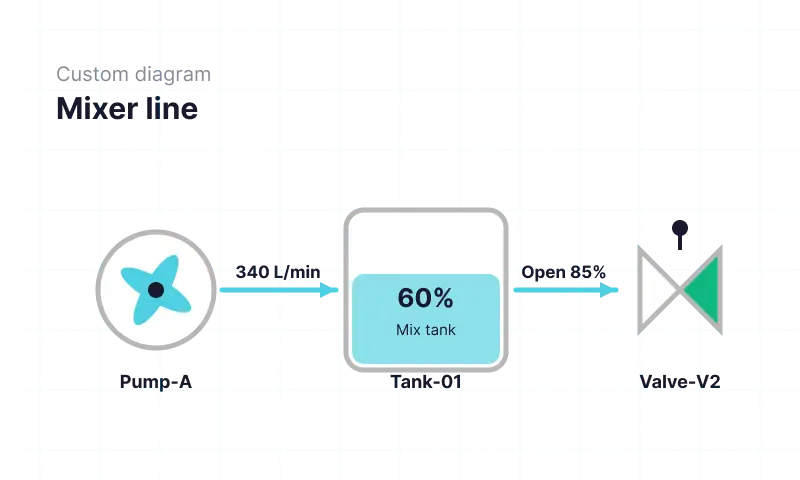
Build custom process diagrams or fully coded widgets for advanced visualization requirements.
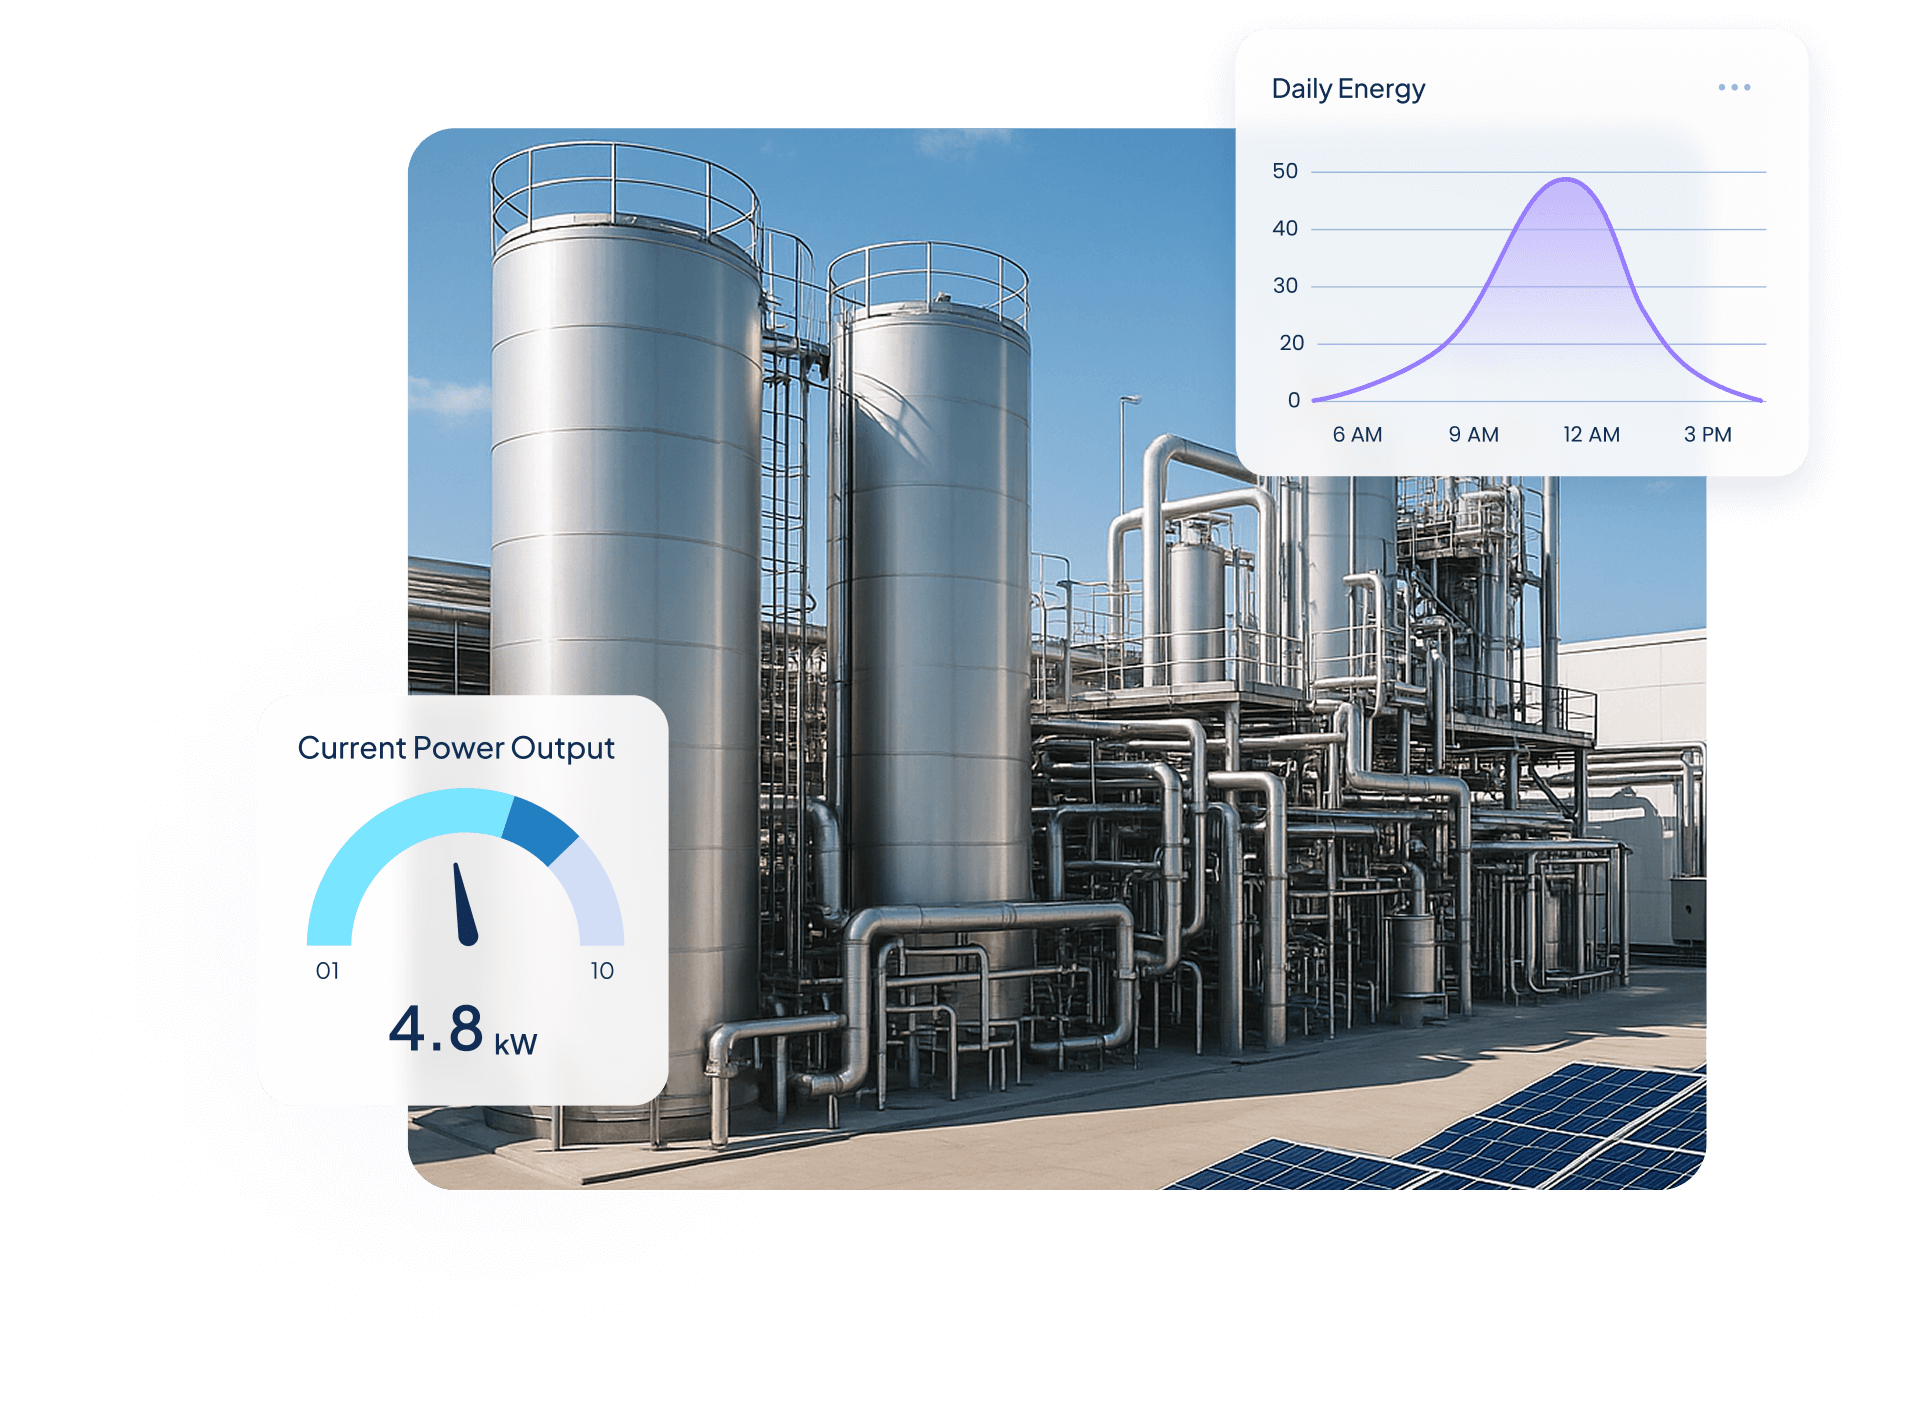
Quantify Environmental uses wireless IoT sensors and Ubidots dashboards to turn utility data into real-time insights, helping industrial clients monitor water, energy, and gas use, detect inefficiencies, and act before costs rise.
$250,000+ in annual client savings through optimized water, electricity, and gas consumption.
Millions of liters of fresh water conserved and tons of CO₂ emissions prevented driving measurable sustainability outcomes.
Improved operational oversight with real-time visibility into utility usage and equipment performance.
Success Story


Use Cases


Steve Barker
Founder & CEO
Prospect Control uses Ubidots to deliver remote tank level monitoring for industrial customers, replacing complex PLC/SCADA setups with a scalable, web-based IoT solution.
Results:


Darryl Schembri
General Manager
AIS Technology uses Ubidots to monitor electricity, water, and gas consumption across multi-tenant buildings, enabling real-time visibility, automated billing, and faster response to inefficiencies.
Results:


Onofre Tamargo
CEO & Cofounder
S4IoT uses Ubidots to remotely monitor irrigation systems in urban gardens, helping clients reduce maintenance costs, prevent plant loss, and shift from manual operations to a scalable subscription-based model.
Results:


Help & Support
Have questions about Ubidots? Here are some ofthe most common queries to help you get started.
Ubidots offers 20+ built-in widget types including line charts, bar charts, gauges, maps, metric displays, tables, tanks, thermometers, switch and slider controls, and SCADA/HTML Canvas. Each widget connects to device variables and refreshes automatically as new data arrives.
Yes. Every widget is configured through a point-and-click interface — select the widget type, connect it to a device variable, set display rules and thresholds, and it goes live immediately. No code is required to build, configure, or share a fully functional IoT dashboard.
In the widget settings, define value ranges and assign a color to each — for example, green for normal, amber for warning, and red for critical. The widget changes color automatically as incoming data crosses each threshold, giving operators an immediate visual status signal without writing code.
Yes. Ubidots dashboards and individual widgets can be shared via a public URL or embedded in any website using an iframe. Access can be restricted by user role, making it straightforward to build white-labeled customer portals that display live IoT data without exposing the full platform.