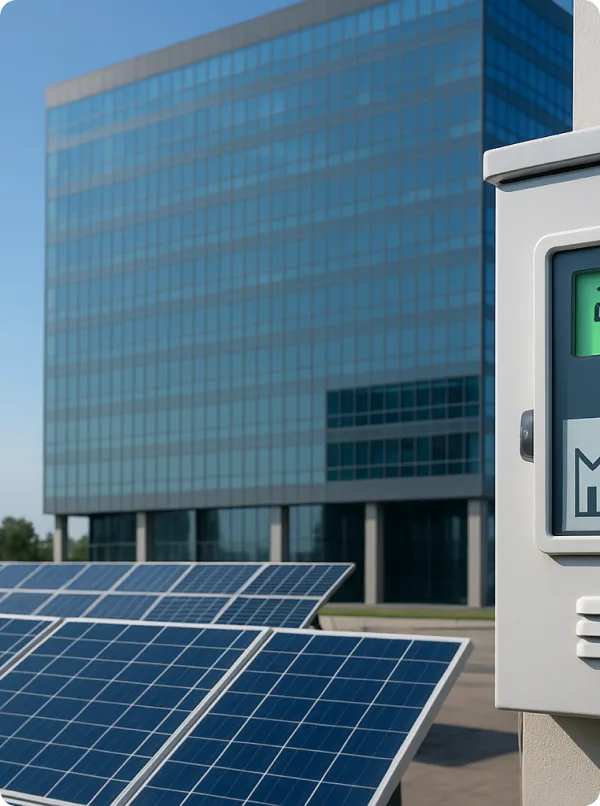
Industries
Track air quality, water conditions, and other environmental data from any location — continuously and at scale.





Benefits

Deploy environmental sensors across remote fields, industrial sites, waterways, and urban areas — collecting data continuously regardless of location or connectivity constraints.

Automatically log environmental readings over time, building structured, long-term records your team can use for EPA filings, environmental impact assessments, and audits.

Set configurable thresholds for any environmental parameter — air quality, water pH, noise levels, emissions — and receive automated alerts the moment a reading goes out of range.

IoT in Action


Product Overview
Transform continuous sensor data — from air quality stations, water monitoring buoys, and weather networks — into the real-time insights and long-term records that environmental decisions depend on.
Effective environmental stewardship starts with reliable, continuous data. Ubidots gives environmental engineers, monitoring agencies, and IoT integrators a real-time view of every sensor in their network — with automated alerts that trigger when parameters exceed safe thresholds, and dashboards that make complex environmental data accessible to every stakeholder.


Environmental reporting depends on showing what you measured, when you measured it, and where. Ubidots stores timestamped sensor data with structured, per-device logs your team can draw on for EPA filings, environmental impact assessments, and third-party audits — and Enterprise plans can extend that record to 10+ years with the Extended Storage add-on.
Whether you’re running an air quality network across an industrial corridor, monitoring water quality along a river basin, or tracking microclimate conditions across a nature reserve, Ubidots connects your sensors through LoRaWAN, cellular, or HTTP — and scales from a handful of monitoring points to thousands, without changing the platform.


Key Features
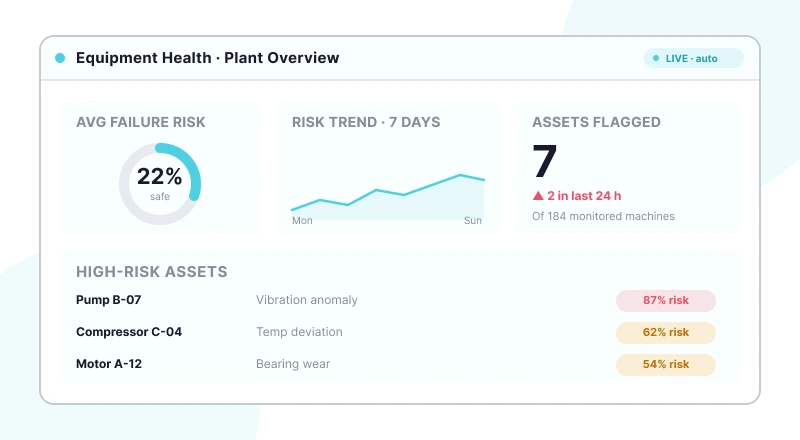
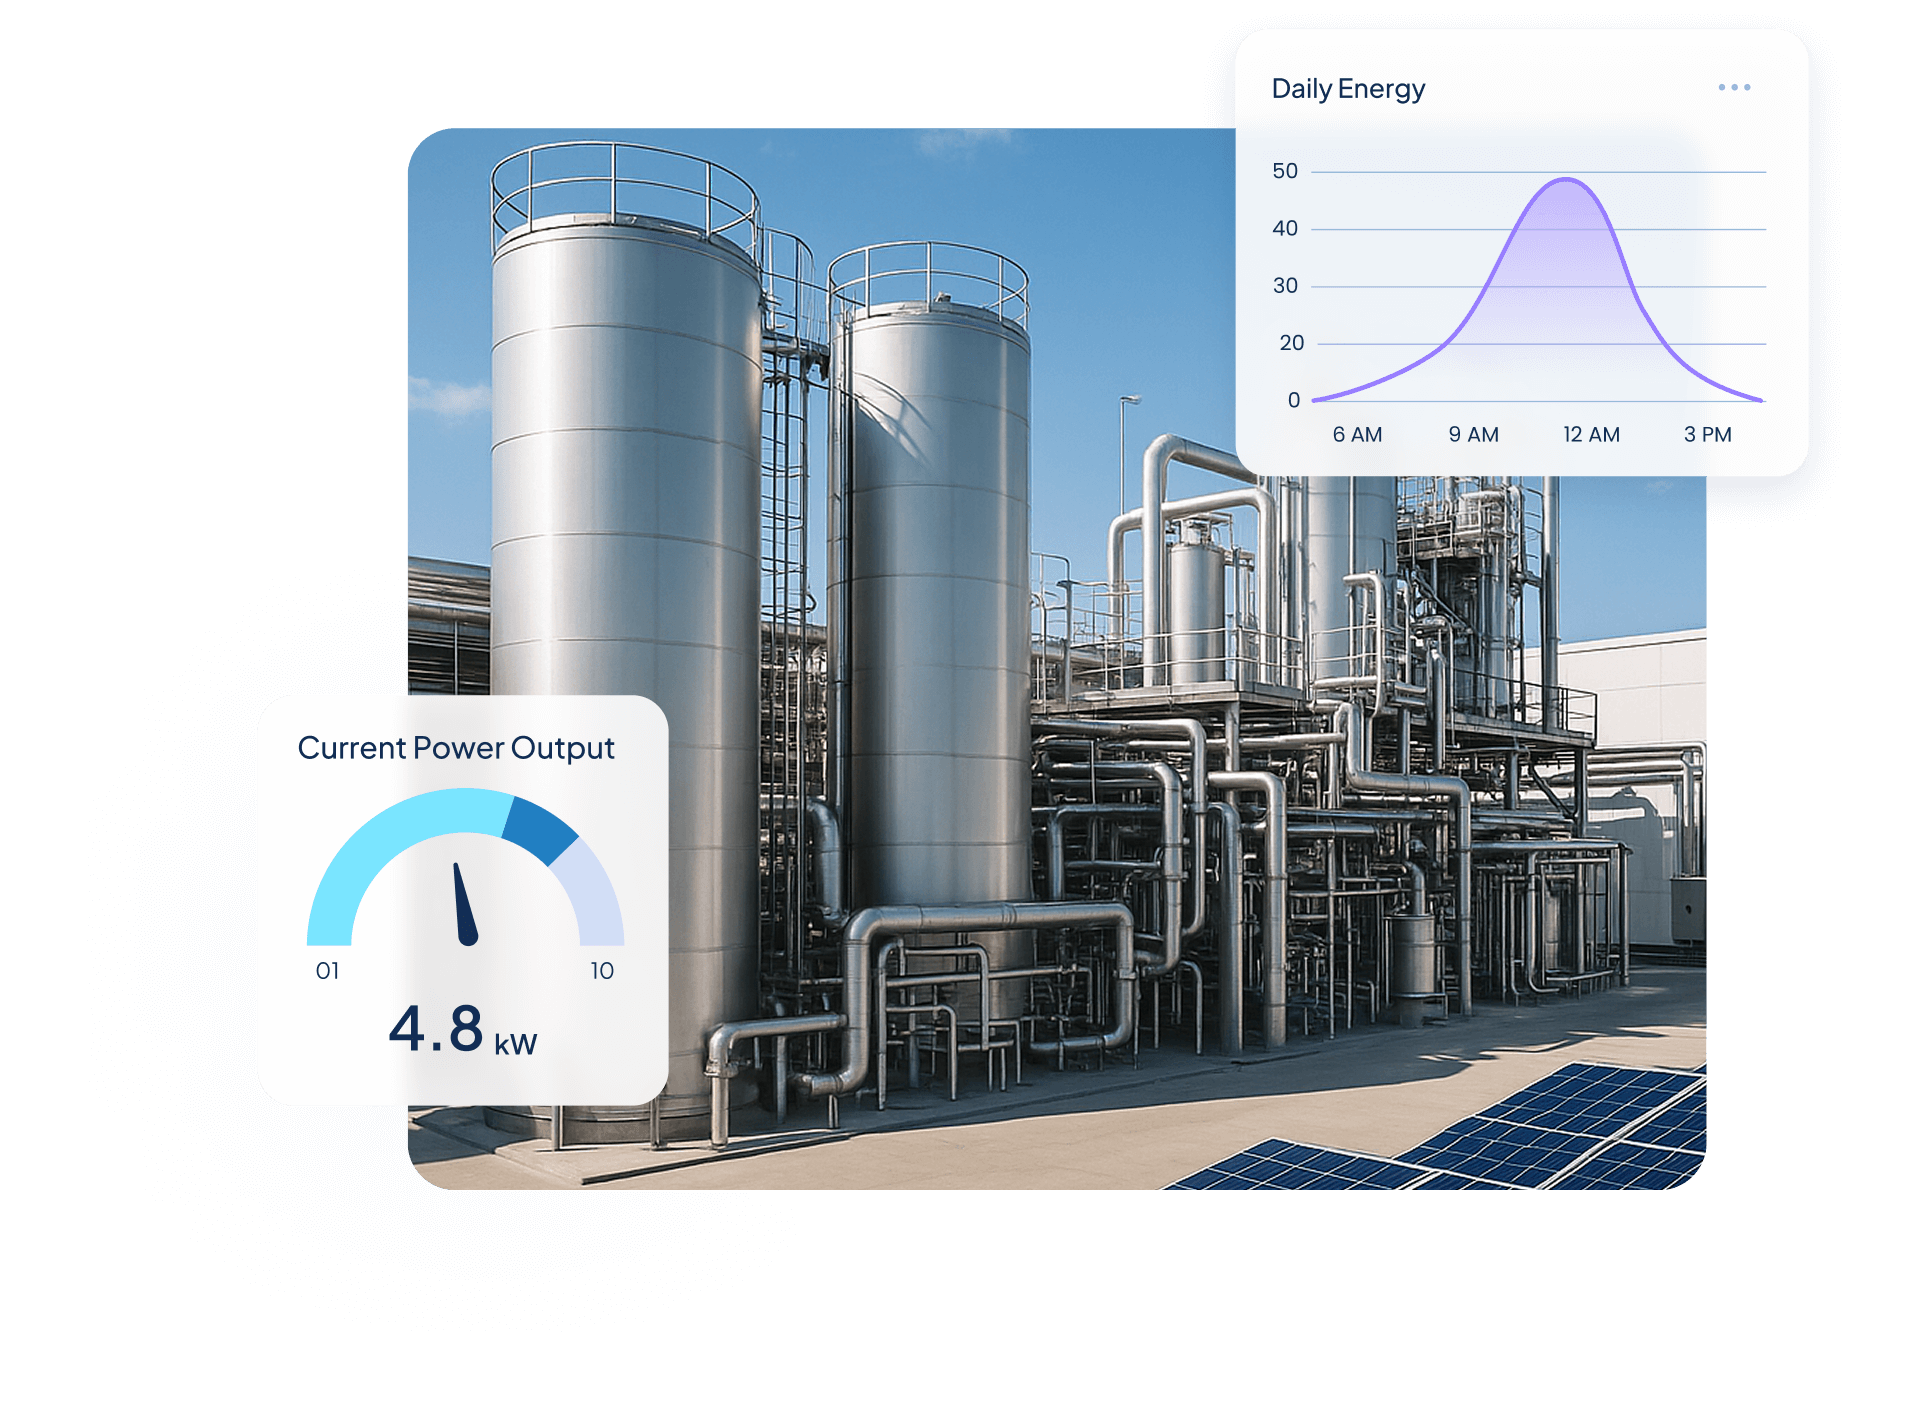
Visualize equipment health, predictions, and maintenance status in customizable live dashboards.
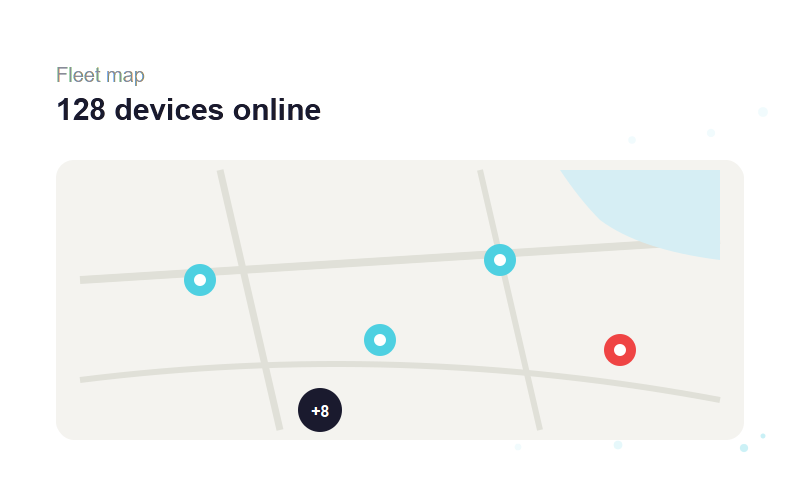
Show device locations on an interactive map with real-time status indicators per device.
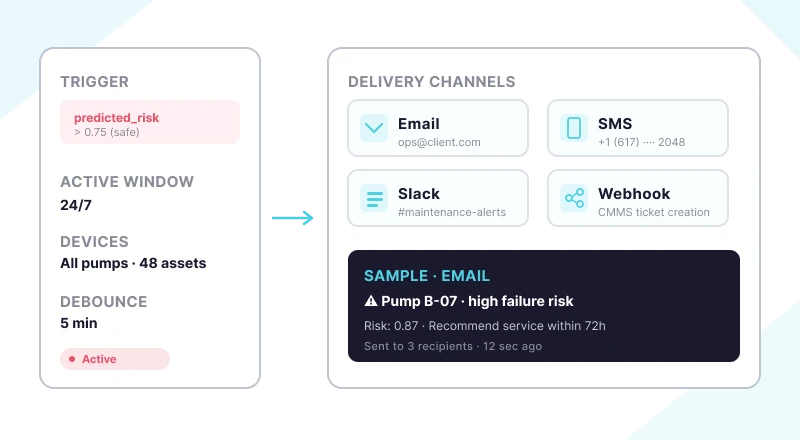
Receive instant notifications when sensor readings exceed predicted safe operating thresholds.
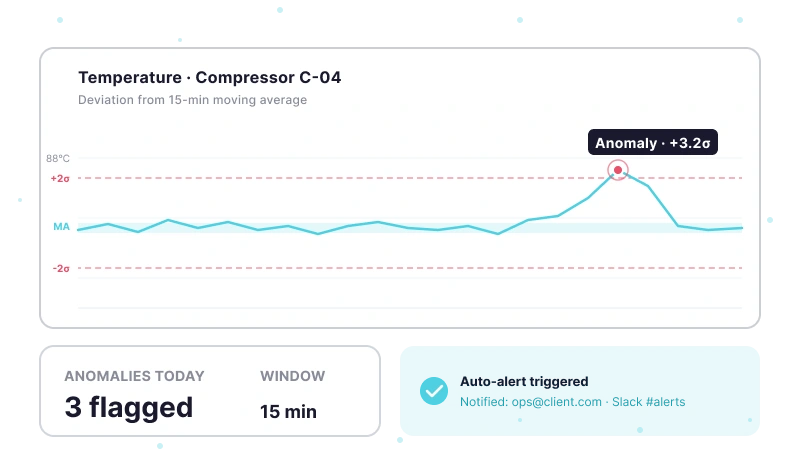
Flag unexpected equipment behavior automatically using configurable moving average algorithms.

Retrieve archived data points programmatically for integration with BI tools and external systems.

Attach values, timestamps, and key-value context metadata—including GPS coordinates—to every data point.
Quantify Environmental uses wireless IoT sensors and Ubidots dashboards to turn utility data into real-time insights, helping industrial clients monitor water, energy, and gas use, detect inefficiencies, and act before costs rise.

$250,000+ in annual client savings through optimized water, electricity, and gas consumption.
Millions of liters of fresh water conserved and tons of CO₂ emissions prevented driving measurable sustainability outcomes.
Improved operational oversight with real-time visibility into utility usage and equipment performance.
Success Story


Use Cases


Steve Barker
Founder & CEO
Prospect Control uses Ubidots to deliver remote tank level monitoring for industrial customers, replacing complex PLC/SCADA setups with a scalable, web-based IoT solution.
Results:


Darryl Schembri
General Manager
AIS Technology uses Ubidots to monitor electricity, water, and gas consumption across multi-tenant buildings, enabling real-time visibility, automated billing, and faster response to inefficiencies.
Results:

Onofre Tamargo
CEO & Cofounder
S4IoT uses Ubidots to remotely monitor irrigation systems in urban gardens, helping clients reduce maintenance costs, prevent plant loss, and shift from manual operations to a scalable subscription-based model.
Results:


Help & Support
Have questions about Ubidots? Here are some ofthe most common queries to help you get started.

Any parameter your sensors can measure and send: air quality, gas concentrations, water pH and other water quality readings, noise levels, emissions, and weather conditions. Ubidots stores each as a time-series variable and lets you set alert thresholds per parameter. Synthetic Variables convert raw sensor signals into engineering units and compute rolling averages over the time window your monitoring standard calls for, without writing code — so the values on your dashboard are the ones you actually report.
Ubidots accepts data from LoRaWAN, cellular, MQTT, and HTTP devices, and MQTT's lightweight publish/subscribe model suits battery-powered stations with limited bandwidth. Each data point can carry its own timestamp, so a station that buffers readings during an outage can upload them later without breaking the record. A device inactivity trigger alerts you when a station stops reporting, so a dead sensor doesn't create an unnoticed gap in your monitoring data.
Ubidots keeps a timestamped, per-device log of every reading, which you can browse in the data navigator, retrieve through the REST API, or export as Parquet files for your reporting tools. GPS coordinates can be attached to each data point, documenting where as well as when a measurement was taken. For multi-year archives, the Extended Storage add-on, available on Enterprise plans, retains up to roughly ten years of data in cold storage. Ubidots provides the monitoring evidence; your filings and their methodology remain your team's responsibility.
Yes. Pre-built plugins such as OpenWeather can be installed in seconds to pull weather data into Ubidots alongside your sensor readings. For other sources — public monitoring networks, laboratory results, or your own databases — Cron plugins and UbiFunctions can call any external API on a schedule and store the results as Ubidots variables. That puts field measurements and context data on the same dashboards and in the same alert rules, without a separate data pipeline.