Industries
Connect building sensors, automate facility workflows, and give every stakeholder the visibility they need to manage smarter.





Benefits

Track temperature, humidity, CO2, and air quality across every zone in real time — ensuring occupant comfort, meeting ventilation standards, and catching HVAC faults before they escalate.

Monitor energy consumption at the circuit, floor, or zone level to identify waste, compare performance across buildings, and target the improvements that deliver the biggest savings.

Understand how your building’s spaces are actually being used — from meeting rooms to entire floors — and use occupancy data to optimize energy scheduling, staffing, and space planning.

IoT in Action


Product Overview
Turn sensor data from HVAC systems, energy meters, occupancy sensors, and building equipment into a continuous stream of operational intelligence — so your building runs better, costs less, and keeps occupants comfortable.
HVAC units running inefficiently, CO2 levels creeping up in occupied rooms, energy spikes on idle floors — these signals exist in your building’s data right now. Ubidots gives facility managers and building automation integrators a real-time view of every monitored system, with automated alerts that flag comfort, efficiency, and equipment issues the moment they emerge — not during the next quarterly review.


The challenge with modern facility management isn’t the absence of data — it’s fragmentation. Ubidots unifies data from HVAC sensors, energy meters, occupancy counters, and building equipment into a single platform, giving operators, engineers, and property managers each the view they need to make decisions faster and coordinate more effectively across systems.
Whether you’re optimizing a single commercial tower or managing a portfolio of office buildings, retail spaces, or campuses, Ubidots scales with your operation. Connect building sensors through MQTT, Modbus gateways, or HTTP, and deploy white-labeled facility management dashboards for property owners, tenants, or facility management clients — without rebuilding your stack for every project.


Key Features
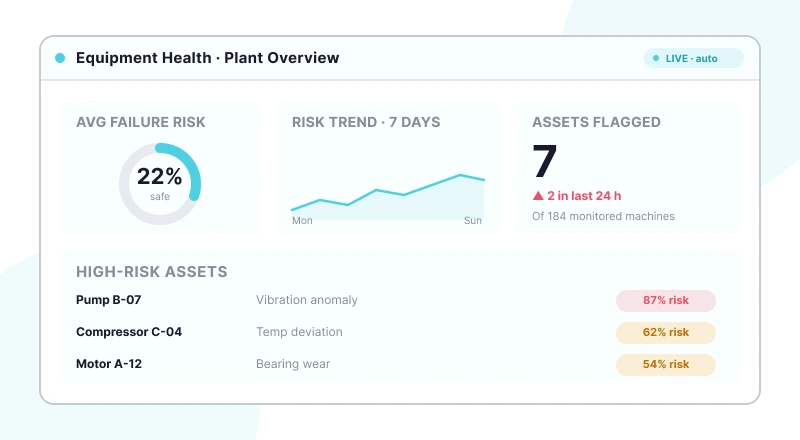
Visualize equipment health, predictions, and maintenance status in customizable live dashboards.
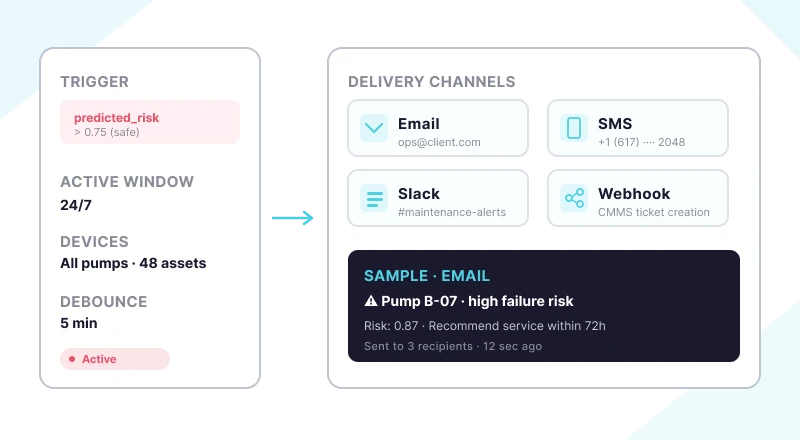
Receive instant notifications when sensor readings exceed predicted safe operating thresholds.
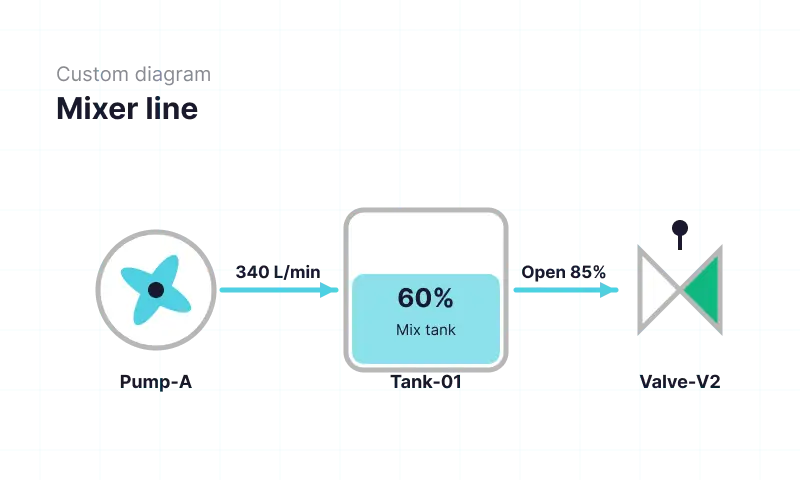
Build custom process diagrams or fully coded widgets for advanced visualization requirements.
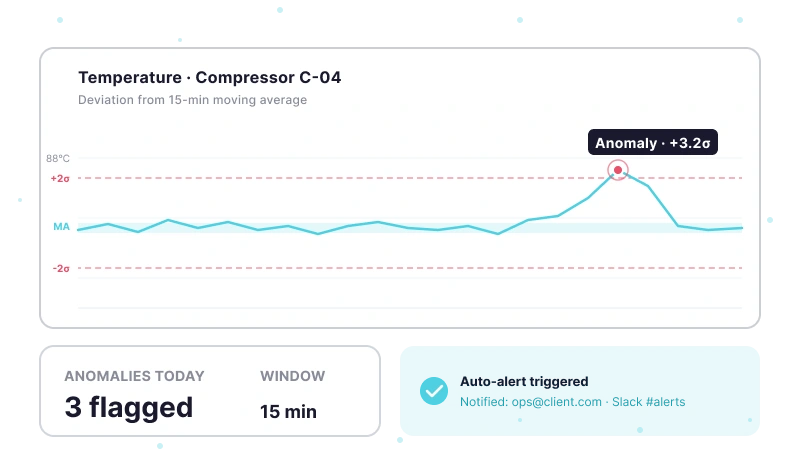
Flag unexpected equipment behavior automatically using configurable moving average algorithms.

Use MQTT subscriptions to push commands and configuration updates back to connected devices in real time.

Combine IoT sensor data with weather, financial, transit, or any third-party API data.
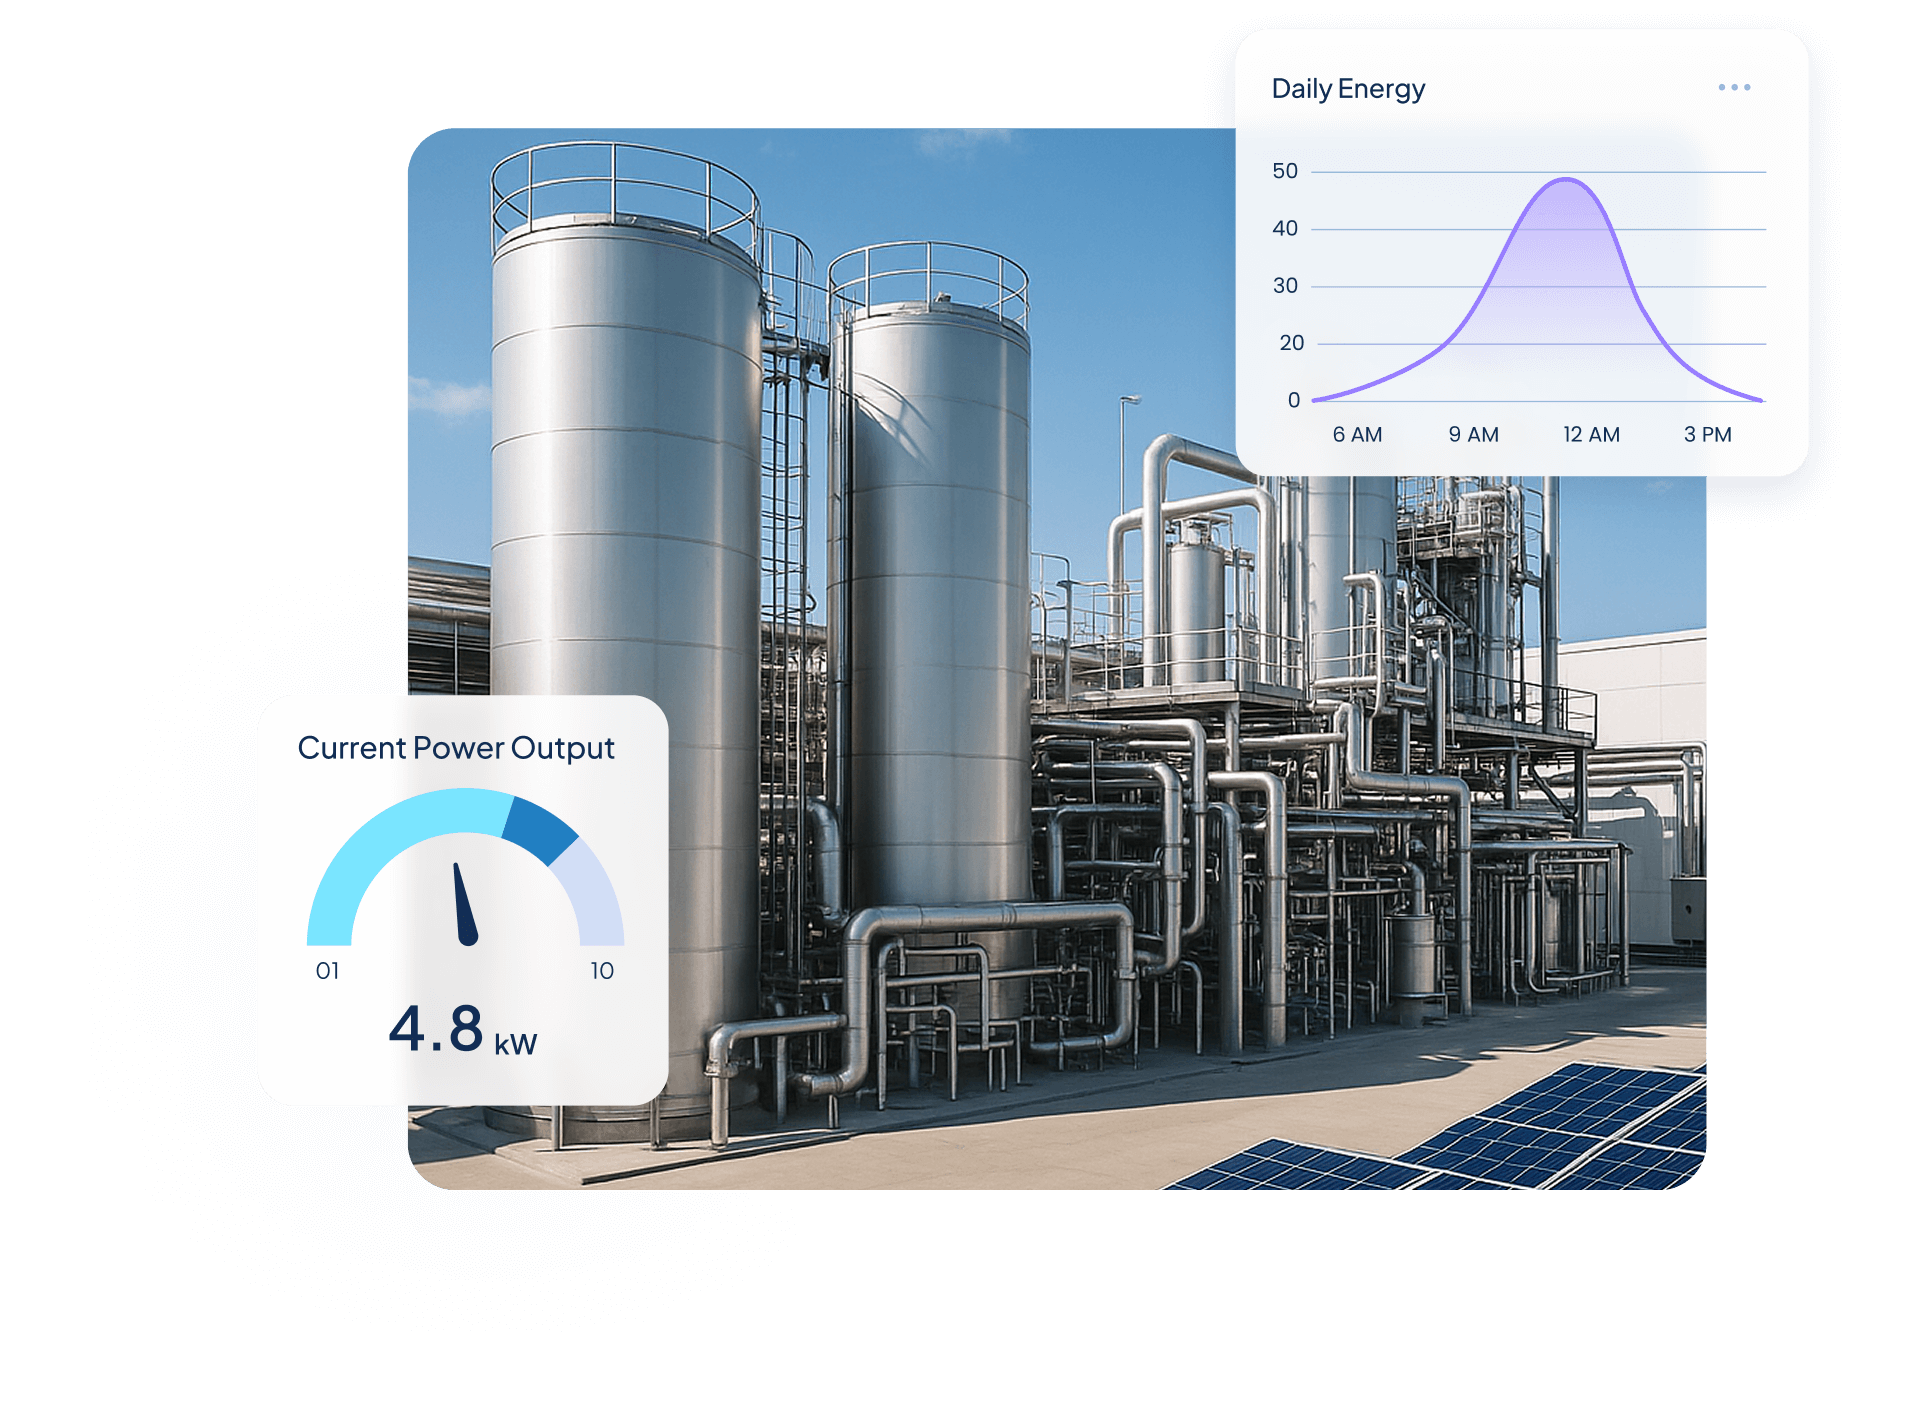
Quantify Environmental uses wireless IoT sensors and Ubidots dashboards to turn utility data into real-time insights, helping industrial clients monitor water, energy, and gas use, detect inefficiencies, and act before costs rise.

$250,000+ in annual client savings through optimized water, electricity, and gas consumption.
Millions of liters of fresh water conserved and tons of CO₂ emissions prevented driving measurable sustainability outcomes.
Improved operational oversight with real-time visibility into utility usage and equipment performance.
Success Story


Use Cases


Steve Barker
Founder & CEO
Prospect Control uses Ubidots to deliver remote tank level monitoring for industrial customers, replacing complex PLC/SCADA setups with a scalable, web-based IoT solution.
Results:


Darryl Schembri
General Manager
AIS Technology uses Ubidots to monitor electricity, water, and gas consumption across multi-tenant buildings, enabling real-time visibility, automated billing, and faster response to inefficiencies.
Results:

Onofre Tamargo
CEO & Cofounder
S4IoT uses Ubidots to remotely monitor irrigation systems in urban gardens, helping clients reduce maintenance costs, prevent plant loss, and shift from manual operations to a scalable subscription-based model.
Results:


Help & Support
Have questions about Ubidots? Here are some ofthe most common queries to help you get started.

Yes. Building equipment and sensors connect through Modbus gateways, MQTT, or HTTP, so you can bring in data from existing HVAC units, energy meters, and occupancy counters without replacing them. Equipment with an active MQTT connection can also receive commands from Ubidots, such as setpoint or schedule changes, triggered manually or automatically by events. Whether a specific system can be controlled depends on it accepting commands over MQTT.
Sensors in each zone report temperature, humidity, CO2, and air quality, and Ubidots shows them on live dashboards with color-coded thresholds — green, amber, red — so problem zones stand out at a glance. Events alert facility teams when CO2 or temperature leaves its target range, and moving average anomaly detection catches an HVAC unit gradually losing performance before occupants start to complain.
Yes. Synthetic Variables turn meter readings into kWh by circuit, floor, or zone, and aggregate them into hourly, daily, or monthly totals. Aggregation dashboards compare the same metric across devices side by side, so you can see which floor or building uses the most energy and when. Weather data can be pulled in through plugins, which helps tell genuine waste apart from heating and cooling demand driven by the weather.
Yes. Each tenant, property, or client can be its own isolated organization that sees only its own data, with roles controlling what each user can view or change. Dashboards and individual widgets can also be shared through a public URL or embedded in another website. With White Label branding, the portal runs on your domain with your logo and colors, so facility management clients experience it as your service.