Industries
Monitor power consumption in real time, detect inefficiencies, and take action before energy waste hits your bottom line.





Benefits

Monitor energy use at the meter, circuit, or equipment level in real time — giving facility and energy managers the visibility they need to make informed decisions.

Automatically flag abnormal consumption patterns, phantom loads, and equipment inefficiencies before they drive up your utility bill or signal a pending failure.

Track load profiles and peak demand patterns to identify opportunities for demand response, shift flexible loads, and avoid costly peak tariff charges.

IoT in Action


Product Overview
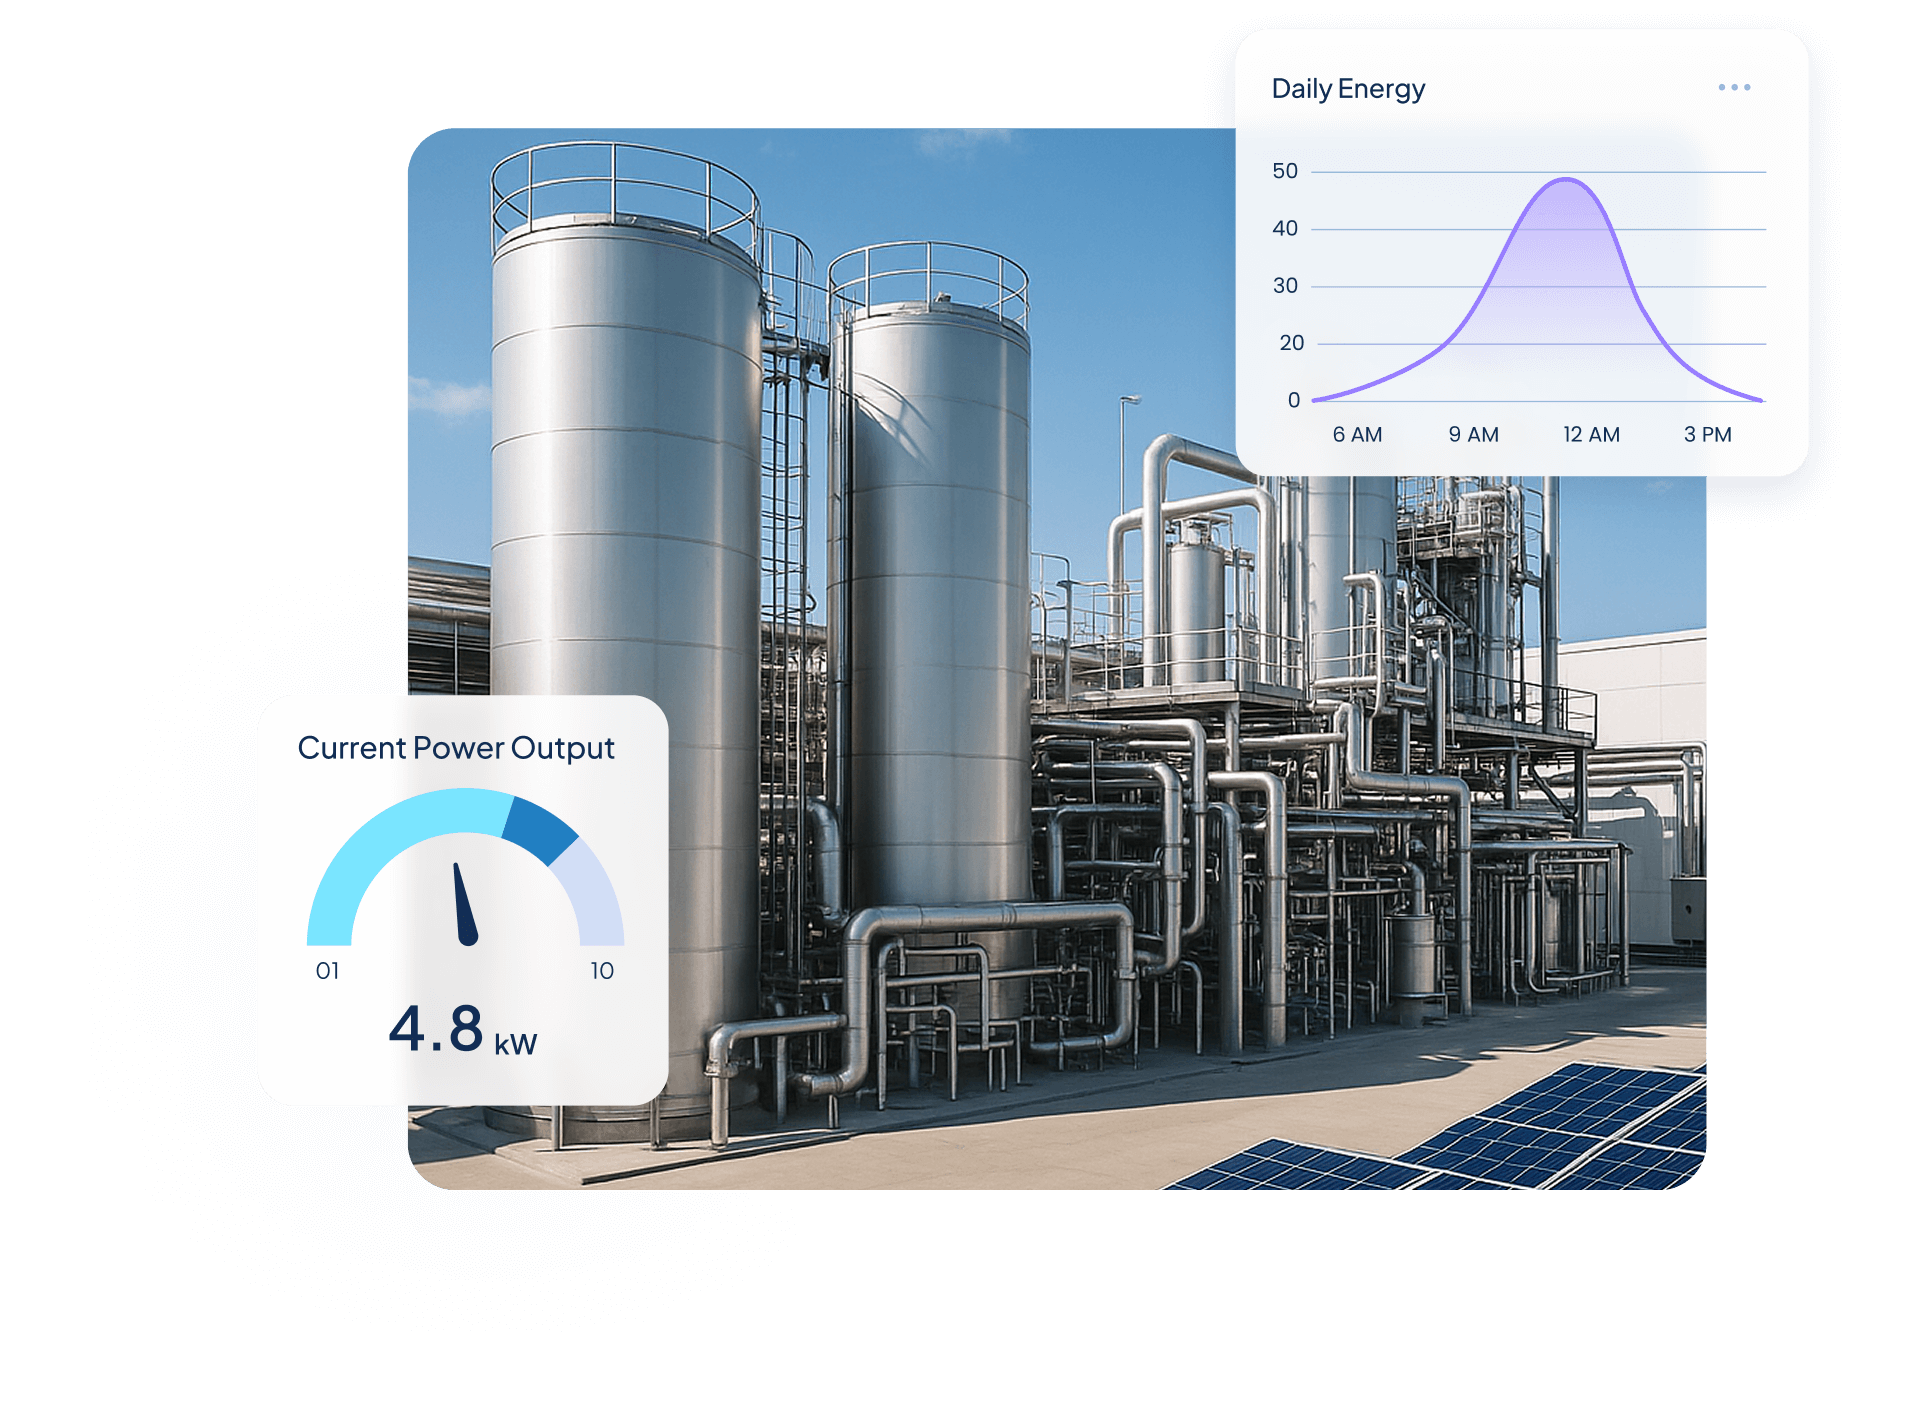
Turn submeter and smart meter data into real-time insights that reveal where energy is being wasted, when demand peaks occur, and what actions will drive the biggest savings.
Most energy waste doesn’t announce itself — it hides in baseline drift, idle equipment, and unmonitored circuits. Ubidots gives energy managers and facility teams a continuous, granular view of consumption across every meter and circuit, with automated alerts that flag anomalies the moment they appear — so you can act before waste compounds into cost.


Real-time data is only valuable if it drives action. Ubidots turns raw consumption data into dashboards that show load profiles, identify peak demand periods, and surface the specific loads contributing most to your energy bill. Energy managers and ESCOs use Ubidots to build data-driven efficiency programs that deliver measurable ROI — and the reporting to prove it.
Whether you’re monitoring a single commercial building or managing energy across a portfolio of industrial facilities, Ubidots scales with your operation. Connect submeters, smart meters, and IoT energy sensors through MQTT or HTTP, and deploy white-labeled energy monitoring applications for every client — without rebuilding from scratch.


Key Features
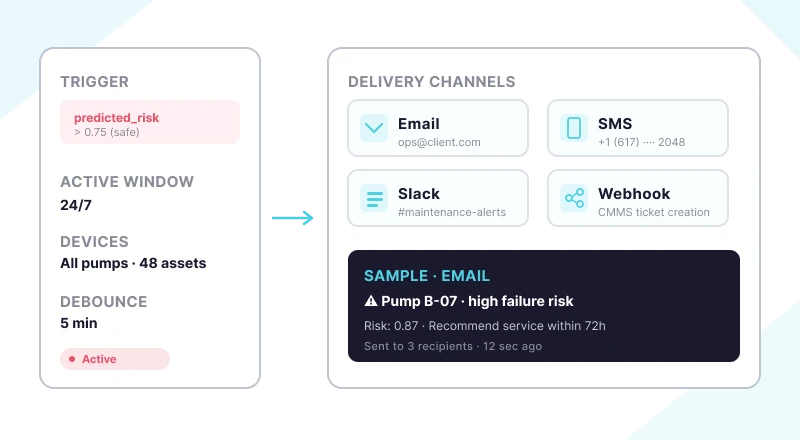
Receive instant notifications when sensor readings exceed predicted safe operating thresholds.
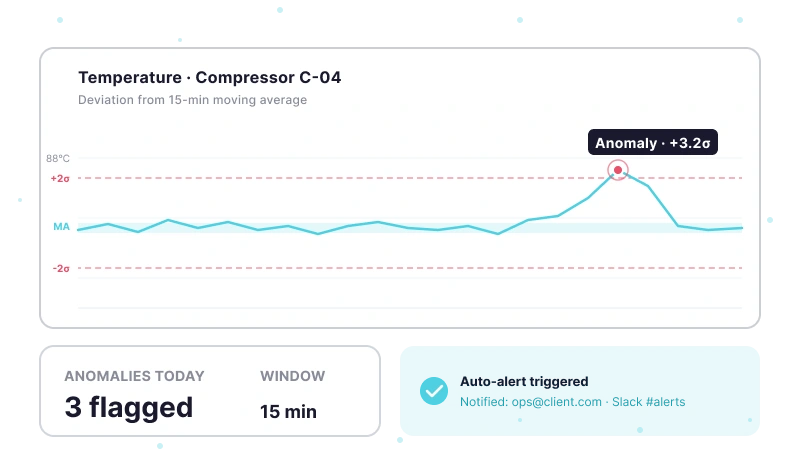
Flag unexpected equipment behavior automatically using configurable moving average algorithms.
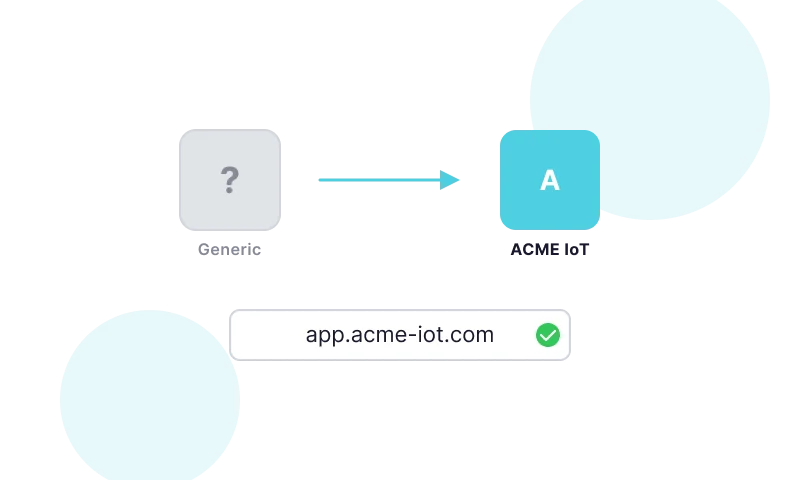
Replace Ubidots branding with your logo, custom domain, and email sender for a fully proprietary app.

Configure both raw sensor variables and synthetic computed variables within a single device type template.

Combine IoT sensor data with weather, financial, transit, or any third-party API data.
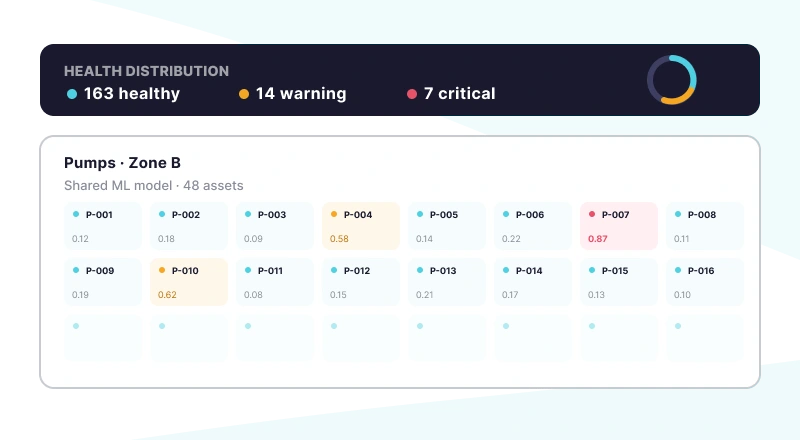
Apply predictive models across entire fleets of machines from a single unified view.
Quantify Environmental uses wireless IoT sensors and Ubidots dashboards to turn utility data into real-time insights, helping industrial clients monitor water, energy, and gas use, detect inefficiencies, and act before costs rise.

$250,000+ in annual client savings through optimized water, electricity, and gas consumption.
Millions of liters of fresh water conserved and tons of CO₂ emissions prevented driving measurable sustainability outcomes.
Improved operational oversight with real-time visibility into utility usage and equipment performance.
Success Story


Use Cases


Steve Barker
Founder & CEO
Prospect Control uses Ubidots to deliver remote tank level monitoring for industrial customers, replacing complex PLC/SCADA setups with a scalable, web-based IoT solution.
Results:


Darryl Schembri
General Manager
AIS Technology uses Ubidots to monitor electricity, water, and gas consumption across multi-tenant buildings, enabling real-time visibility, automated billing, and faster response to inefficiencies.
Results:

Onofre Tamargo
CEO & Cofounder
S4IoT uses Ubidots to remotely monitor irrigation systems in urban gardens, helping clients reduce maintenance costs, prevent plant loss, and shift from manual operations to a scalable subscription-based model.
Results:


Help & Support
Have questions about Ubidots? Here are some ofthe most common queries to help you get started.

Moving average anomaly detection flags consumption that drifts from a meter's normal pattern, such as baseline creep from equipment that is degrading or left running. Active windows make after-hours waste easy to catch: an event that can only fire outside business hours alerts you when consumption stays above a threshold overnight or at weekends, the typical sign of phantom loads and idle equipment. Alerts reach your team by email, SMS, Slack, or webhook.
Yes. A Synthetic Variable can compute demand over a rolling window, such as a 15-minute moving average, and an event can warn your team before it reaches your peak threshold. Where loads are controllable, the same event can send a command over MQTT to shift or shed a flexible load. Over time, load profile dashboards show when peaks occur and which loads drive them, so you can plan demand response with data rather than guesswork.
Synthetic Variables convert raw meter signals into engineering units, calculate energy as power over time, and aggregate the result into hourly, daily, or monthly totals — all configured in the interface, with no code. Multiplying by your tariff turns kWh into cost. For tariffs that change over time, a Cron plugin or UbiFunction can pull current rates from an external source so the cost calculation stays accurate.
Yes. Each client gets an isolated organization with its own meters, dashboards, and users, and White Label branding delivers it on your domain with your logo. Dashboards show consumption before and after an efficiency measure, and the REST API lets you pull the same data into your own reporting or BI tools. Device Types let you standardize meter configurations, so onboarding each new client site is repeatable.