Industries
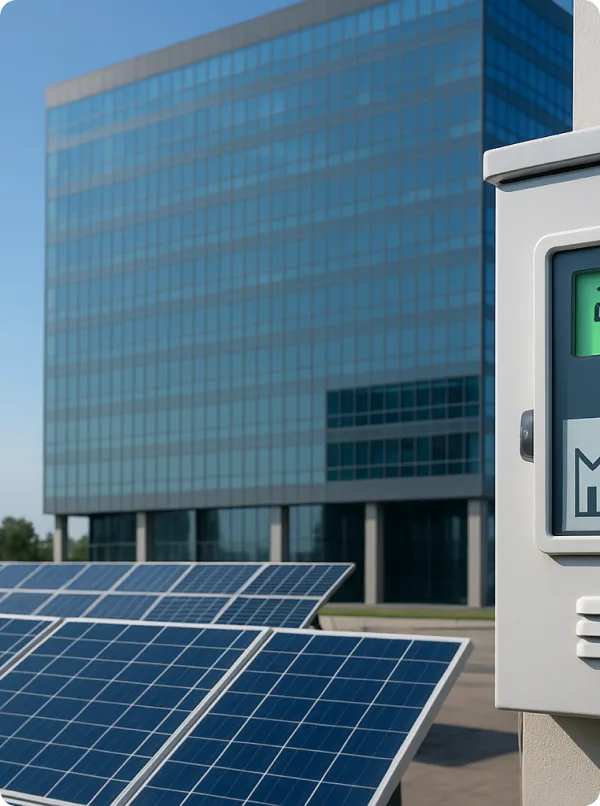
Monitor grid assets, prevent outages, and optimize energy distribution with IoT.





Benefits

Use real-time telemetry to anticipate transformer, substation, and feeder failures before they cause outages — extending asset life and lowering maintenance costs.

Identify non-technical losses, energy theft, and efficiency gaps across the distribution network with real-time consumption analytics.

Keep 10+ years of grid and consumption data with the Enterprise Extended Storage add-on, ready to draw on for regulatory reporting, rate-case filings, and audits.

IoT in Action


Product Overview
Transform raw grid, meter, and sensor data into real-time insights that prevent outages, reduce losses, and keep your energy and water networks running at peak efficiency.
With Ubidots, your grid and distribution infrastructure can communicate with you in real time, streaming live telemetry through clean dashboards and triggering automated alerts the moment something drifts out of spec. Ubidots empowers utility operators and energy system integrators to develop data-driven, cloud-based applications — without the overhead of building custom infrastructure.


In today's rapidly evolving energy landscape, utilities face mounting pressure to modernize aging infrastructure, integrate distributed energy resources, and meet strict regulatory targets. Smart utility integrators turn to Ubidots for sensor data collection, analytics, and visualizations that help detect asset faults, uncover non-technical losses and non-revenue water, and track the operational KPIs that matter most — whether that's grid reliability (SAIDI, SAIFI), non-revenue water, power quality, or energy intensity across a commercial portfolio.
Whether you're connecting smart meters over MQTT, bringing SCADA data in through Modbus gateways, or integrating cellular and LoRaWAN field devices, Ubidots gives your engineering team the APIs, serverless functions, and role-based access controls they need to roll out utility monitoring applications at scale — on your timeline, not a vendor's.


Key Features
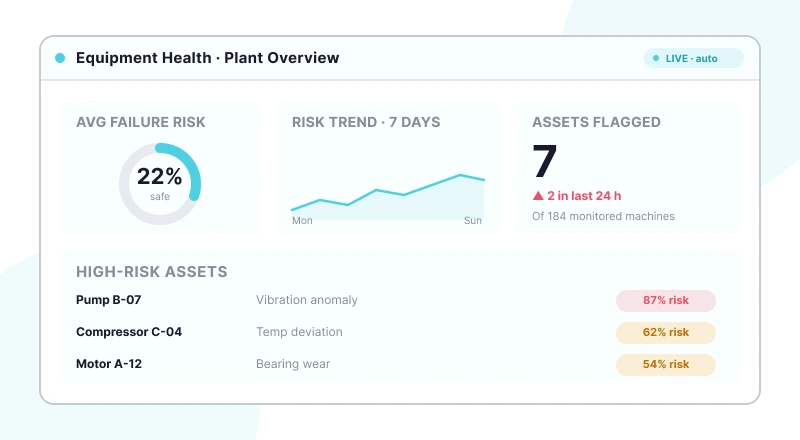
Visualize equipment health, predictions, and maintenance status in customizable live dashboards.
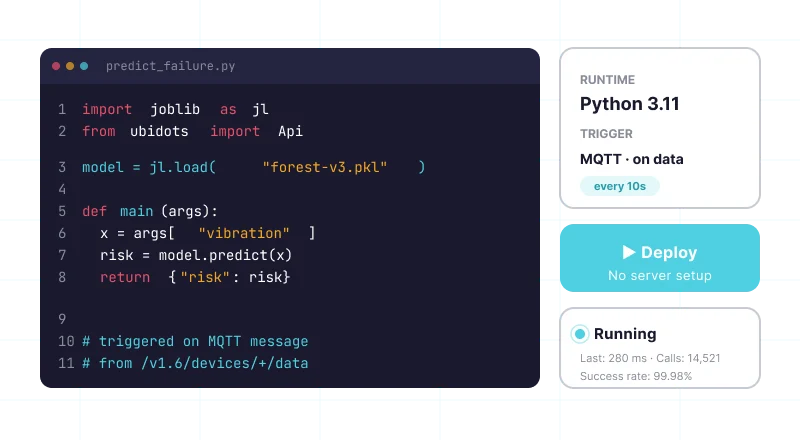
Run Python machine learning models serverlessly via UbiFunctions without managing infrastructure.
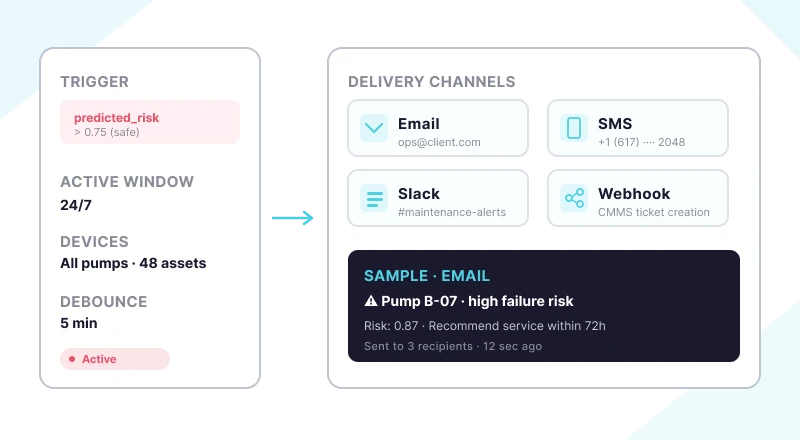
Receive instant notifications when sensor readings exceed predicted safe operating thresholds.

Plugins run on Ubidots' proven serverless engine for reliable, scalable execution.
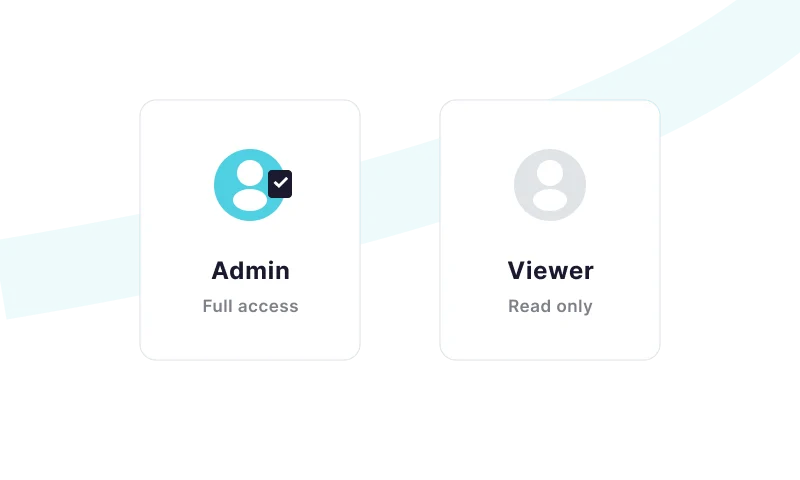
Define user roles and permissions to control what each user can view and interact with.
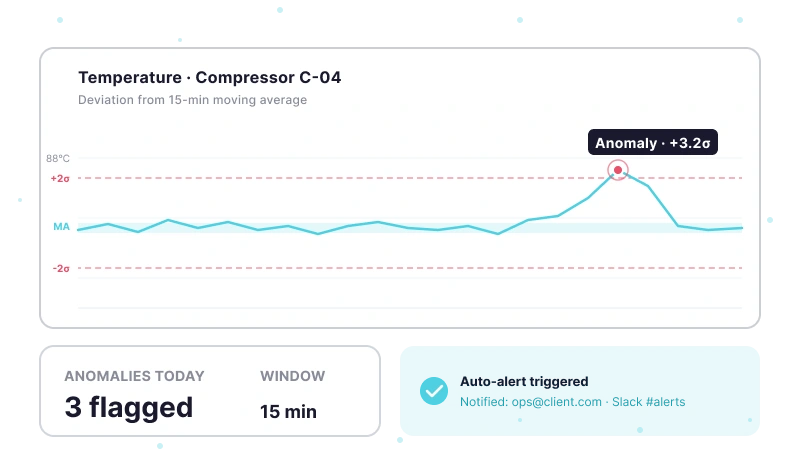
Flag unexpected equipment behavior automatically using configurable moving average algorithms.
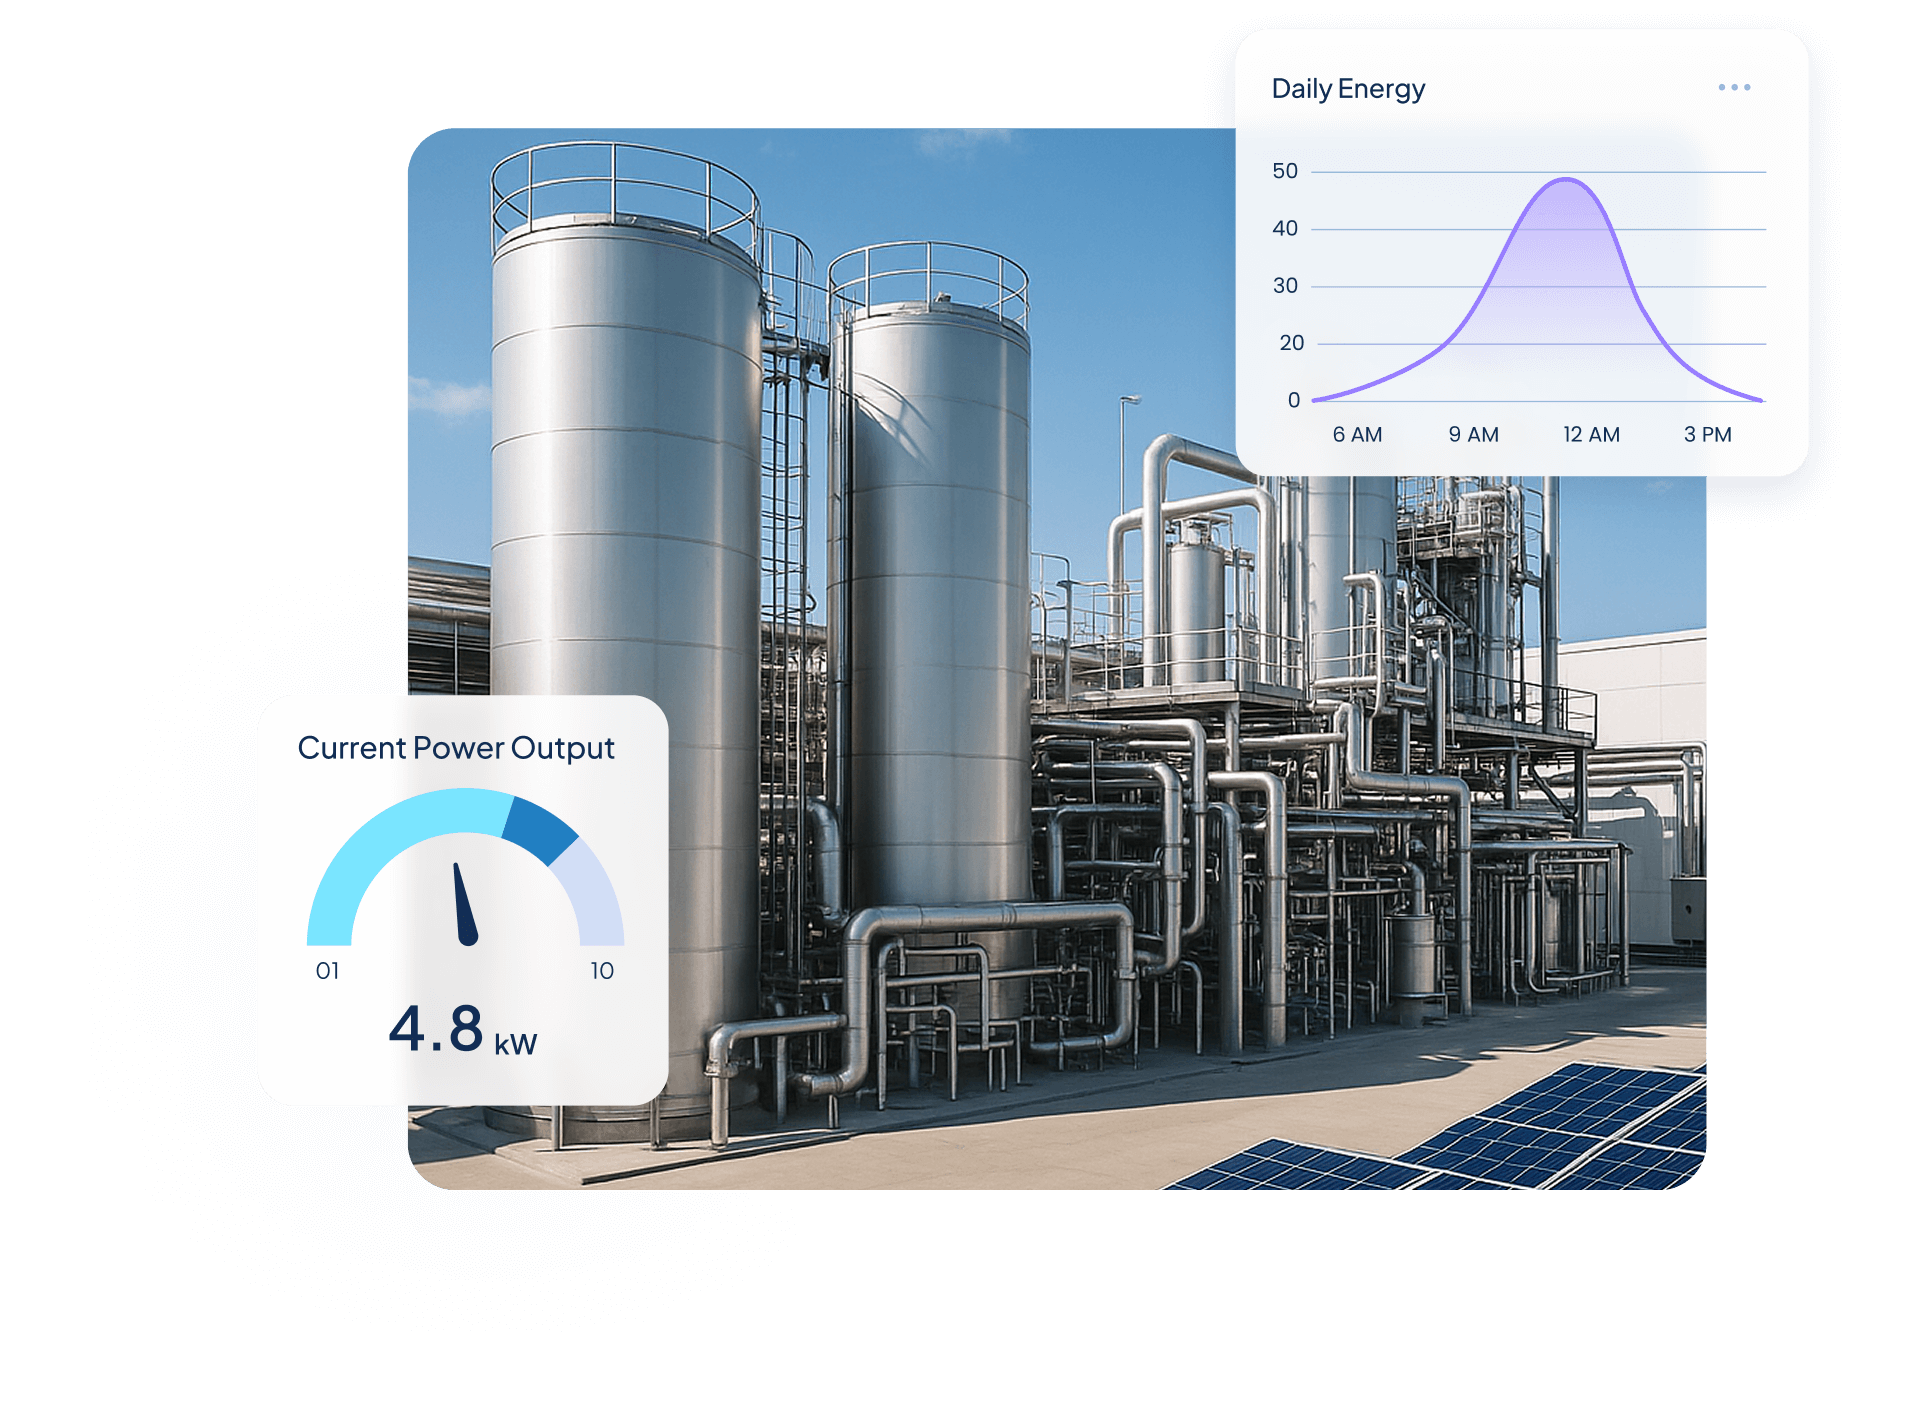
Quantify Environmental uses wireless IoT sensors and Ubidots dashboards to turn utility data into real-time insights, helping industrial clients monitor water, energy, and gas use, detect inefficiencies, and act before costs rise.

$250,000+ in annual client savings through optimized water, electricity, and gas consumption.
Millions of liters of fresh water conserved and tons of CO₂ emissions prevented driving measurable sustainability outcomes.
Improved operational oversight with real-time visibility into utility usage and equipment performance.
Success Story


Use Cases


Steve Barker
Founder & CEO
Prospect Control uses Ubidots to deliver remote tank level monitoring for industrial customers, replacing complex PLC/SCADA setups with a scalable, web-based IoT solution.
Results:


Darryl Schembri
General Manager
AIS Technology uses Ubidots to monitor electricity, water, and gas consumption across multi-tenant buildings, enabling real-time visibility, automated billing, and faster response to inefficiencies.
Results:

Onofre Tamargo
CEO & Cofounder
S4IoT uses Ubidots to remotely monitor irrigation systems in urban gardens, helping clients reduce maintenance costs, prevent plant loss, and shift from manual operations to a scalable subscription-based model.
Results:


Help & Support
Have questions about Ubidots? Here are some ofthe most common queries to help you get started.

Smart meters and field devices can publish over MQTT or HTTP, SCADA data can be brought in through Modbus gateways, and cellular and LoRaWAN field devices connect as well. If a data source uses a non-standard format, UbiFunctions can decode it before it's stored. All sources land in the same data model, so grid, meter, and sensor readings share one set of dashboards and alerts.
Yes. Synthetic Variables can calculate across devices — for example, comparing the volume or energy supplied into a district against the sum of its metered consumption — and track that gap continuously. Moving average anomaly detection flags consumption patterns that deviate from a meter's normal behavior, and events alert your team when the gap or the anomaly crosses a threshold. This narrows down where losses are occurring so field crews can focus their investigation.
Yes. UbiFunctions runs Python machine learning models serverlessly: a scheduled function reads recent telemetry — temperature, load, or other condition signals — runs your model, and writes a failure risk score back to Ubidots, where it can trigger alerts before an outage. For simpler cases, threshold alerts and moving average anomaly detection need no model at all. ML accuracy depends on historical data that includes past failures.
With the Extended Storage add-on, available on Enterprise plans, Ubidots archives up to 500 GB of data — roughly ten years, depending on ingestion frequency — to cold storage in Parquet format. Archived data stays accessible through the dashboard's data navigator, the REST API, or Parquet downloads, so rate-case filings and compliance audits can draw on the full history. Professional and Industrial plans keep data for their standard retention period.